Are you looking for a simple way to bring live process data into Power BI for dashboards and visualization? OPC Router’s REST plug-in provides a flexible and secure way to push data from your industrial systems to Power BI using its Streaming Dataset API.
In this blog, we’ll walk you through the steps of setting up a live connection between OPC Router and Power BI using the REST interface, so you can transform your raw data into real-time insights for your team.
While this blog is geared towards existing Router users, Even if you’re new to OPC Router, this walk through can show you what’s possible when combining live industrial data with Power BI. If you’d like to explore OPC Router further, check out our getting started videos—they’ll give you the foundation you need to begin building your own real-time dashboards.

Why Connect OPC Router to Power BI?
OPC Router is a powerful data integration platform designed for automation environments. With its wide variety of plug-ins, including OPC UA, MQTT, databases, SAP, REST, and more, it enables seamless communication between OT and IT systems.
By using the REST plug-in to send data to Power BI, you unlock:
- Real-time visibility of your process KPIs
- Centralized dashboards for operators, engineers, and management
- Easy integration with your existing cloud reporting infrastructure
- Custom alerting and decision-making support based on live data
Step 1: Set Up the Streaming Dataset in Power BI
- Log in to Power BI at https://app.powerbi.com.
- From the sidebar, select “My workspace” at the bottom.
 Click on “New item” and search/choose “Streaming dataset”.
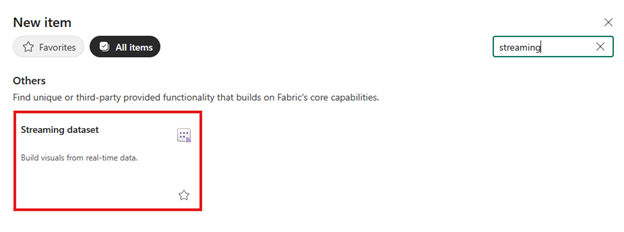
- Select “API” as the data source and click “Next”.
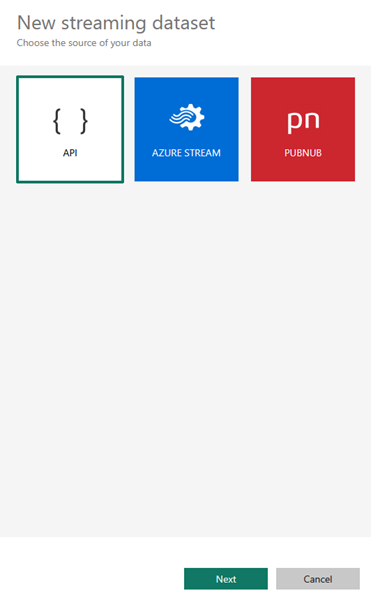
- Name your dataset, then define your desired data fields and types (e.g., temperature, pressure, timestamp, etc.).
- Enable “Historic data analysis” to allow visualization of trends over time.
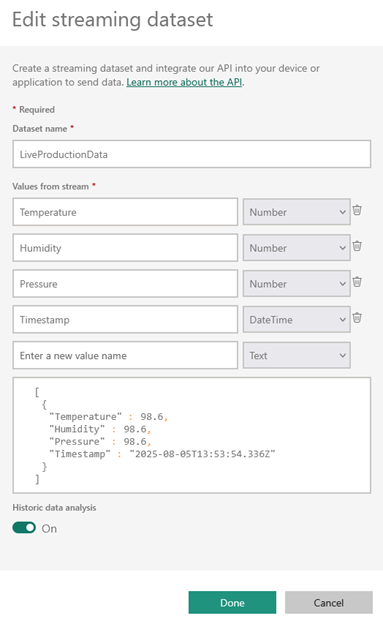
- Click "Done" to create your Streaming dataset.
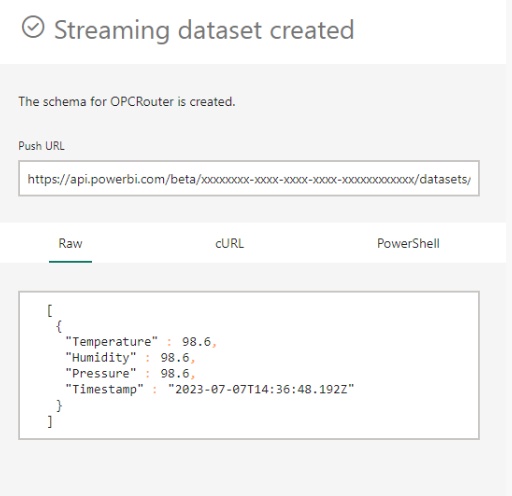
You’ll be presented with a Push URL and example JSON schema. Copy both — you’ll need them to configure the OPC Router.
Example Push URL: https://api.powerbi.com/beta/{workspace_id}/datasets/{dataset_id}/rows?experience=power-bi&key={your_key}
Step 2: Prepare the Push URL for OPC Router
You’ll break the URL into components for configuration in OPC Router:
- Base URL: https://api.powerbi.com/beta/{workspace_id}/datasets/{dataset_id}
- Endpoint: /rows
- Query Parameters:
- experience = power-bi
- key = {your_key}
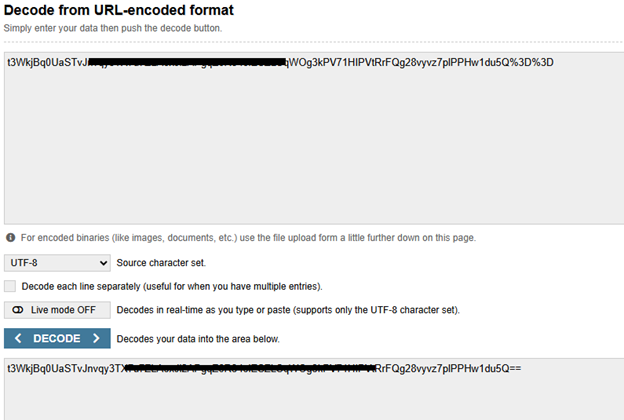
Important: The key must be URL-decoded before entering it in OPC Router. Use a free tool like urldecoder.org to decode the string.
Example decoded key:
Y7FiThHsLEM+7vbni6BSDRdgnVcdBYz9b2gTjDSnswFZkBk+ybnTiSr6Wp7wZzZf64KI4ZnxLsh48Aq2KDUwrg==
Step 3: Create the REST Connection in OPC Router
- Open OPC Router.
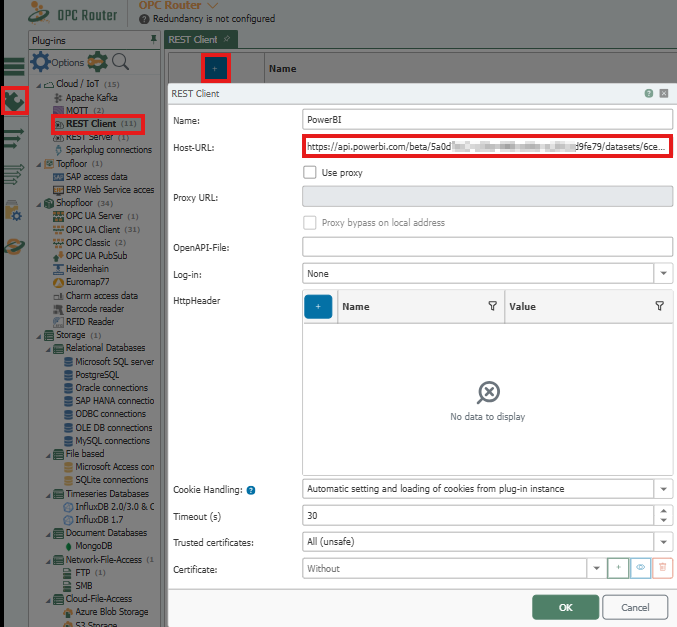
- Navigate to Plug-ins and select REST Client.
- Click the blue plus (+) icon to create a new connection.
- Give the connection a descriptive name.
- Paste the Base URL (Push URL excluding the Endpoint and Query Parameters) into the Host-URL field.
- Click OK to save.
Step 4: Build the REST Transfer Object
- Navigate to Transfer Objects in the right sidebar.
- Drag a REST Client Transfer Object from the right onto a new Connection workspace.
- Double-click it to open the configuration.
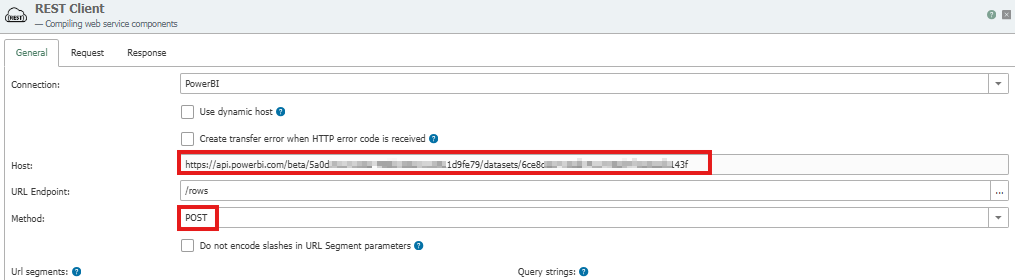
In the configuration:
- URL Endpoint: /rows
- Parameters:
- experience = power-bi
- key = (your decoded key)
- Set parameter type to QueryString
- Method: POST
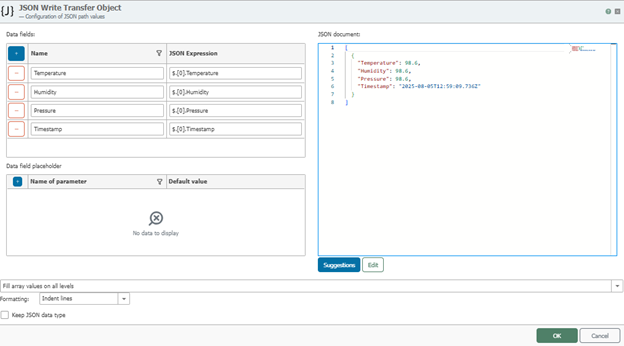
Step 5: Configure the JSON Write Transfer Object
- Create a JSON Write Transfer Object.
- Double-click it to open.
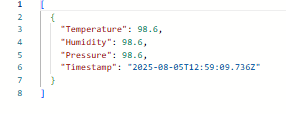
- Select Edit on the Right and Paste the JSON schema copied from Power BI.
- Click Edit and define the structure by creating fields (e.g., temperature, timestamp). Click the “fx” button on each value to create the fields.
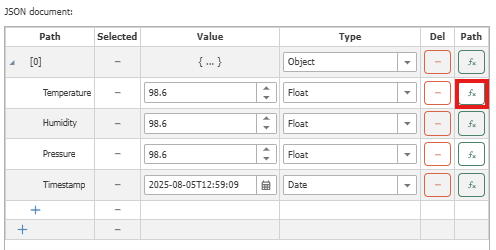
- Click OK when complete.
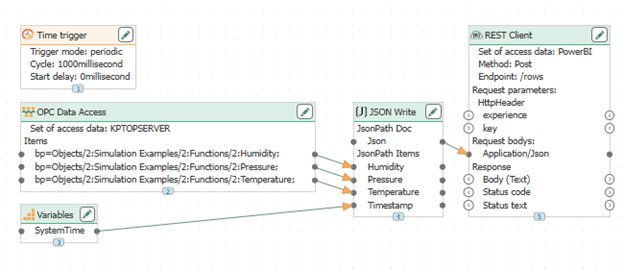
Step 6: Connect Data Flow in the OPC Router Workspace
Now connect your components together:
- Connect the JSON output of the JSON Write object to the Body (Text) input of the REST object.
- Because OPC Router is trigger-based, you’ll need to add a trigger that matches how often you want your dashboard to update. In this example, I’ve used a time trigger with a one-second interval.
- Finally, connect any data source as input to the JSON Write object to populate your fields. Here, I’m using OPC UA tags as the data source.
Activate the connection by clicking the Publish icon (second from the bottom in the sidebar). 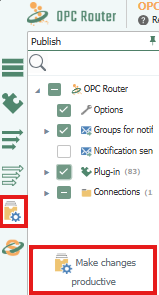
Step 7: Visualize Real-Time Data in Power BI
With the connection active, Power BI will begin receiving data in real time. You can now:
- Create custom dashboards using the streaming dataset
- Combine with historical sources for hybrid views
- Monitor production, energy use, or machine status live
Here’s an example of a real-time dashboard built using this method: 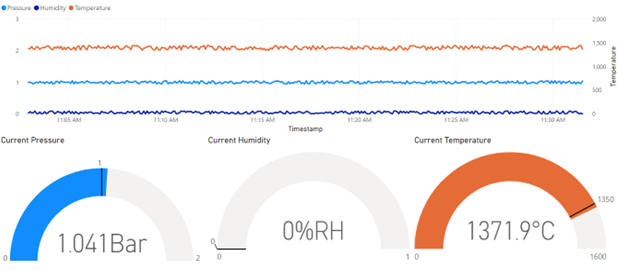
Final Thoughts: Power BI + OPC Router for Smarter Insights
Connecting OPC Router to Power BI using the REST plug-in is a powerful way to create real-time dashboards from your process data — without needing complex middleware or IT support. Whether you’re pulling values from OPC UA servers, databases, or MQTT devices, OPC Router gives you the tools to format and transmit data to the cloud with confidence.
Want to learn more about OPC Router and its other integration possibilities? Visit our OPC Router product page.
Need help designing your connection or evaluating if OPC Router is a good fit? Contact our team today.