The heart of any control system is the computers and servers that run your automation software. For example, when PLCs talk to AC drives over Ethernet, the drives will shut down if they lose communications for more than a second, sometimes even milliseconds. Drives shutdown = Line shutdown = Plant shutdown. What IT calls a blip for plant operations can mean downtime, scrapped product and even your company’s reputation due to missed delivery deadlines.
Traditionally, server maintenance and upkeep is the role of IT. However, when these systems go down, it affects operations (OT) with different pains than IT sees on the business side. IT has systems to monitor their own assets, on the standards they need for the business, but they need the OT side to expand monitoring of their own systems and self-reliance in order for OT to meet operational needs, while bringing in IT as a resource.
This blog post will discuss how to get information about health of servers and PCs that runs the automation software OT users need without having to rely solely on IT.
What information you collect on your servers’ health will depend on the role that server plays in your control system. Just like in our blog post about redundancy, it all depends on the cost of downtime and process interruptions. The higher the cost, the more important it is to manage the server health.
But the real question is, “What information is it possible to collect about the health of my servers and put on my HMI/SCADA screens?” If you’re familiar with Windows Task Manager, you’re probably familiar with a lot of the types of information available on a machine, and when you get into Windows Performance Counters it gets even deeper. There are literally hundreds of parameters that get into the health of processes, hardware, and the operating system.

Here are some common examples of what statistics our users have told us they have found useful when monitoring the health of their own systems.
- Available Memory
- CPU Usage
- Available Disk Space
- Network Card Utilization
- Internal Temperature
- What Processes are running and has a process gone down?
- How much Memory a specific process is using
Since it’s always helpful to have examples to refer to in determining your own specific uses, I’ll share how several of our users are actually monitoring and using this information.
Measure How Much Bandwidth Are Your OT Systems Using?
Let’s take Network Card Utilization details on a machine, for example. We have a user who is performing remote monitoring and his computer is on a cellular network. He needs to ensure that he is not overwhelming that cellular connection with too much data. Why? As you can imagine, remote sites using cellular networks can easily use substantial bandwidth if some form of checks aren’t in place, which can get extremely costly.
Also, it’s not uncommon for the overall amount of available bandwidth to be limited in such remote locations. This makes it important to keep a close tab on exactly how much data is being used by connected computers and equipment. As you see below Windows Task Manager provides a view of usage on each Ethernet connection on your PC. Well those counters can also be programmatically accessed from the operating system by other software that wants the information.

So this user uses that ability to access the performance counter to monitor the Total Bytes sent over that network card and he uses that number to make decisions to disable connections to non-critical devices to decrease overall bandwidth utilization. It’s more practical for operations to turn off non-critical devices than risk losing critical data due to bandwidth constraints.
Can I check if an HMI, SCADA, MES or other Software Application is Running or Crashed?
We have also seen users monitor whether or not key applications or services are running. For example, maybe you have an I/O Server or a utility that is critical to your control process that needs to be running at all times. Just like bandwidth usage, Task Manager lets you see every process in the system and its process ID or PID and Status, and that data is also available to other software applications.

If the application or service stops, these users are monitoring those applications or services and also have the ability to launch the application again automatically, minimizing the down period. Although Windows services can restart themselves on newer operating systems, regular applications cannot. We even have an example using Cogent DataHub’s scripting ability that can monitor the Notepad application and restart it if it stops. You can use this example and modify it to restart whatever key application or service you need to always be running.
Is my HMI, SCADA, OPC application or other software Leaking Memory?
We have also had users that need to detect memory leaks in other applications. This is possible by simply monitoring the Working Set of memory for the application in question. Working Set is another standard Windows performance counter that is accessible from other software applications.

It’s then possible to trend this data over time and understand the impact of the memory leak and how bad it is. This makes it possible to take action to minimize any negative effects, whether that means working with the vendor to resolve the memory leak or worse case periodically restarting the application.
How do I collect HMI, SCADA, MES, OPC software health information?
So, obviously, the operating system on your computers and servers have this information available. But how do you access that data in a usable form that you can monitor and integrate with your control systems to put the information in front of operations users instead of some distant IT control room or operations center with different definitions of what an actual problem is?
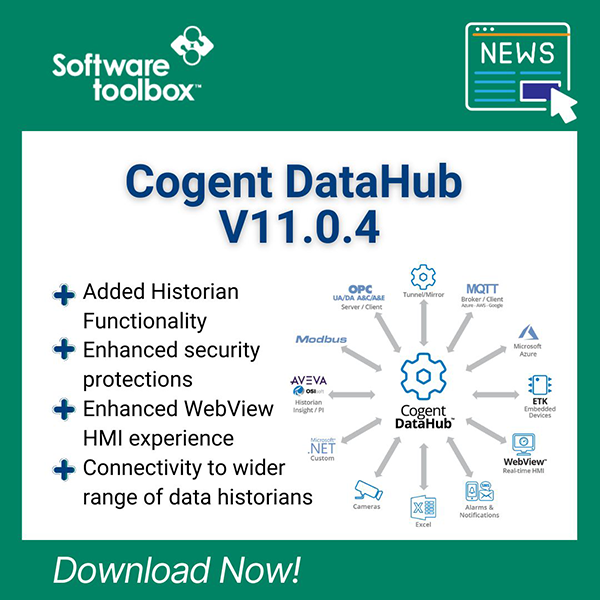
The software our users commonly implement to collect system health information is called the Cogent DataHub, specifically using a feature called System Monitor.

The System Monitor feature utilizes Windows performance counters and allows you to take ANY piece of data you can see in the Windows Performance Monitor and make it into a DataHub tag. And, once this information is in DataHub, any OPC DA, OPC UA or DDE client can access it. This means that you can put the information on HMI, SCADA, MES screens, log to your historian, and tie into your alarming or call-out systems.
What else can I do with this OT application health data?
Once your Windows performance counter data about OT software health is in the DataHub, you can use any of the other available DataHub features to put that data to work for you. Besides simply reading this data with your HMI/SCADA or integrating with other systems, the Cogent DataHub offers features to handle using the information directly such as displaying it in a web page or logging it to a database.

You can even send email/SMS alerts from the DataHub based on the information you are monitoring. Simply define thresholds for when a monitored value is out of range and the appropriate engineer or technician will be notified of a particular issue either before it occurs or immediately when it occurs, minimizing or possibly eliminating any negative impact on your process.
How do you monitor more than one automation software server?
Since one of the main features of the DataHub is moving real-time information between computers, it is easy to monitor ALL computers and servers and aggregate all of this data into a single monitoring station running a DataHub. From this centralized DataHub, you can then use all the features of the DataHub to visualize, store or alarm off of this information across your entire enterprise or deliver the information to existing HMI, SCADA, MES, Historian, or Alarming/Call-out applications.

I hope this post has spurred some insights on the types of automation/OT software and hardware health information that you can capture on your own systems as well as how to use this data to make your life easier and even more productive. By monitoring the health of your computers, servers, and software applications that run your control system, you have the ability to find problems and fix them before they cause unplanned downtime and expense for your business.

The DataHub offers a wide range of functionality for accomplishing an extremely diverse set of challenges many users, like you, may experience on different integration projects. For those of you not familiar, some of that built-in functionality includes bridging data between different sources, sending email or SMS text reports or notifications, acting as a gateway solution between different types of OPC and other data sources and more.