To manage a process well, it's about more than just producing. It's necessary to measure how efficiently that process is producing. A process increases in profitability as it runs more efficiently (producing the same amount using the least amount of resources).
In this short blog post, we'll discuss some of the metrics or key performance indicators (KPIs) that should be available for a particular process and how measuring those KPIs can increase the profitability of your operations. And we'll discuss how you probably already have the raw data sitting there and how you can turn that raw data into actionable information.
It's easy to just say that a process should be running as efficiently as possible to maximize profits. But how do you actually measure just how efficiently your process is running?
What Key Performance Indicators (KPIs) Can Help with Profitability?
In an ideal world, if your supervisor asked you one of the following questions, you'd either know the answer right away or be able to easily access the answer in under five minutes (from a report or dashboard, potentially):
- How much did we produce by area, by shift, by material?
- What was the average temperature per batch?
- How much water are we using from hour to hour, day to day, month to month, year to year?
- How much electricity are we using by time period, by area, by shift?
- Which of our production lines are using more or less electricity?
- Which of our products cost more to manufacture?
- Which of our shift teams operates most efficiently?
- Which of our factories produces most efficiently?
- Which of our factories is most consistently following our production plan?
Insert any of your own questions that you've potentially been asked by a manager or co-worker. And I'm sure some of these questions you are already somehow calculating answers to on some timeframe - but how long does it normally take you? Five minutes? Half an hour? A day? More?
And if it's taking you significant time to determine these questions of efficiency, how much profitability is being lost in that time? One of the keys to maximizing efficiency and profitability is effectively monitoring resource usage and identifying any over-consumption issues as quickly as possible so such issues can be corrected sooner rather than later (time really is money, after all).
Real-World Example: Correcting Inefficient Water Usage in the Beer Brewing Process
I'll give you a real life example. A large brewery had a water usage target as part of their standard production plan - they know how much water their brewing process should be using per liter of beer in an ideal world and they knew they were using more water than that.
However, before implementing FLOW Software to help automate the generation of their KPIs, including water usage, the brewery didn't have a clear idea of just how much money was being wasted in each batch just through overuse of water. The cost ended up actually being around seven times greater than originally believed because it was being measured only in percentages and not financial costs.
With this actionable data provided by FLOW, the brewery was able to correct the problem and save thousands of dollars, while improving the efficiency of the brewing process. With the water usage data in the proper context, the decision makers at the brewery were empowered to make the best decision possible.
How to Generate Actionable KPIs From Your Process Data
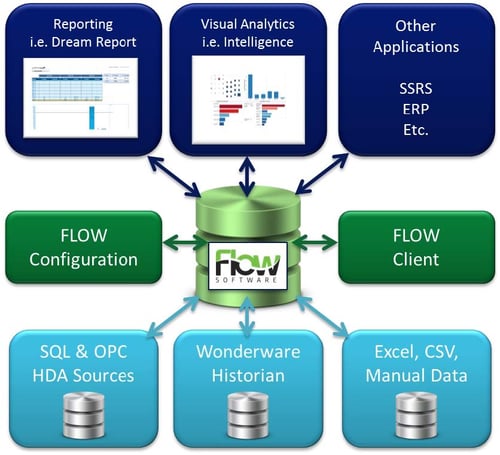
FLOW is a powerful KPI calculation engine that combines collected and manually entered data via expressions, functions, aggregations and roll-ups. FLOW adds context to KPIs by relating them to production events (e.g. batch, product, shift team, etc.). FLOW evaluates KPIs against targets or limits for notification.
FLOW allows you to:
- Turn operations data into answers to enterprise business questions
- Rapidly automate creation of value-added information from manual & automatic data
- Enhance visualization, reporting & decision-making performance
- Reduce engineering time & loading on existing data stores
- Increase flexibility and system performance
If you're interested in improving your processes which can lead to less downtime, increased profitability (and maybe even impress your boss...), just take a look at what FLOW can help you do with your process data.