A common question I run into when talking to OmniServer users is "How can I gain more visibility into what is going on with my OmniServer." After all, a primary concept for an OPC Server is to be invisible – to be a transparent converter between the protocol used by a device, and that used by your SCADA or HMI (i.e. OPC, Wonderware SuiteLink, etc.).
While there are a number of answers to how you can be more aware of what is going on with your system, this fourth post in our "OmniServer Did You Know?" blog series focuses on the importance of system tags, and specifically how they can be used in the OmniServer to query the health of the server as a whole, as well as individual device connections.
In an ideal world, there would never be any problems with a connection (whether between your client and OmniServer or between OmniServer and your devices). You would start OmniServer, power up your devices, connect with your HMI/SCADA system and forget about it for the next 20 years.
Of course, we all know that in reality that is not the case and the sooner that an issue can be identified, the sooner it can be fixed. Time is, after all, money as they say.
If you missed our third post on using initial values in OmniServer, get caught up here!
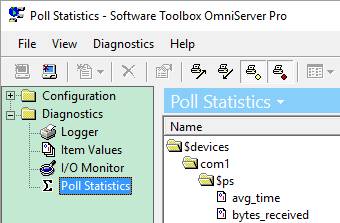
The OmniServer exposes a number of system tags, both at the device level and at the topic level, that provide important information on the current status of the server.

How Can I Do This?
Device system tags can be accessed with the syntax $devices.<device name>.$ps.<tag name> (see table below for specific tags available). Similarly, topic system tags can be accessed with the syntax <topic name>.$ps.<tag name> (see reference table below). OmniServer exposes the following tags:
|
System Tags Available at the Topic and Device Level
|
|
Tag Name
|
Description
|
|
avg_time
|
The average response rate of the device
|
|
bytes_received
|
Number of bytes received
|
|
bytes_sent
|
Number of bytes sent
|
|
cod_attempted
|
Computer on demand messages attempted
|
|
cod_completed
|
Computer on demand messages completed
|
|
edc_failures
|
Number of failures due to a checksum error
|
|
packets_received
|
Number of packets received
|
|
packets_sent
|
Number of packets sent
|
|
polls_attempted
|
Number of polls that have been attempted
|
|
polls_completed
|
Number of polls that have been completed
|
|
timeouts
|
Number of failures due to a timeout
|
|
System Tags Only Available at the Topic Level
|
|
Tag Name
|
Description
|
|
clients_connected
|
The number of clients currently connected to this client
|
|
sod_attempted
|
Server on demand messages attempted
|
|
sod_completed
|
Server on demand messages completed
|
Why Would I Need To Do This?
There are many reasons having access to such system tags from your HMI/SCADA would be useful. Adding these tags to your client application provides all sorts of calculated statistics information, including the health of the connection as a percentage (polls_completed/polls_attempted), as well as, providing an easy way to create a heartbeat to the server.
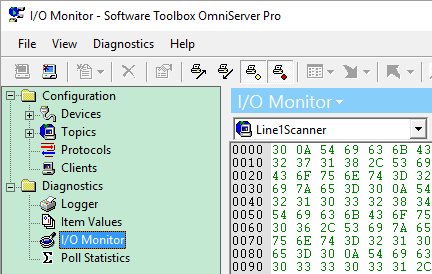
What if the number of bytes sent stops updating? Well, chances are, there is an issue with the connection to the device, prompting you to use OmniServer's other diagnostic tools such as the I/O Monitor and Event Logger.

And, since you are able to monitor these statistics from your client application, your operators will know there is an issue right away, allowing you to start troubleshooting the root issues more quickly, minimizing downtime and getting things back to normal as quickly as possible. Saving you time and, therefore, saving you money.
Where can I get more information?
Would you like to start monitoring OmniServer statistics from your client but you're not sure how to get started? As always, we're happy to help answer questions you may have.
Email us at support@softwaretoolbox.com with your questions and subscribe to our blog for more quick and easy OmniServer tutorials and tips. Then, make sure to download the latest OmniServer trial to try it yourself for free.
