Applications tend to have a lot of moving parts. Here at Software Toolbox, we know that understanding these parts is important whether you are new to an application or a seasoned veteran who wants a more robust understanding for the sake of troubleshooting and optimization. Because of this, part of our job is to help you recognize and understand the components of our products to maximize your ROI when using our solutions.
In this blog post, we'll provide an overview of the different components of OPC Data Logger, an effective solution for reliable, event-driven logging of data from OPC server data sources (both OPC UA and OPC DA) to SQL and ODBC databases (including Microsoft Azure SQL) or text and CSV files. We'll cover the wizard-based interface used for Configuration, the difference between the Service and Runtime, and the Notification functionality so you can understand the purpose of each component and how to configure them to meet your logging needs.
If you are new to OPC Data Logger, we recommend a quick exploration of our OPC Data Logger website before reading this article; however, you will not need a ton of experience with OPC Data Logger to understand the information in this post.
OPC Data Logger Configuration
The OPC Data Logger configuration can be launched from the Start Menu as “OPC Data Logger Configuration”, or from DataLogger.exe at C:\Program Files (x86)\Software Toolbox\OPC Data Logger.
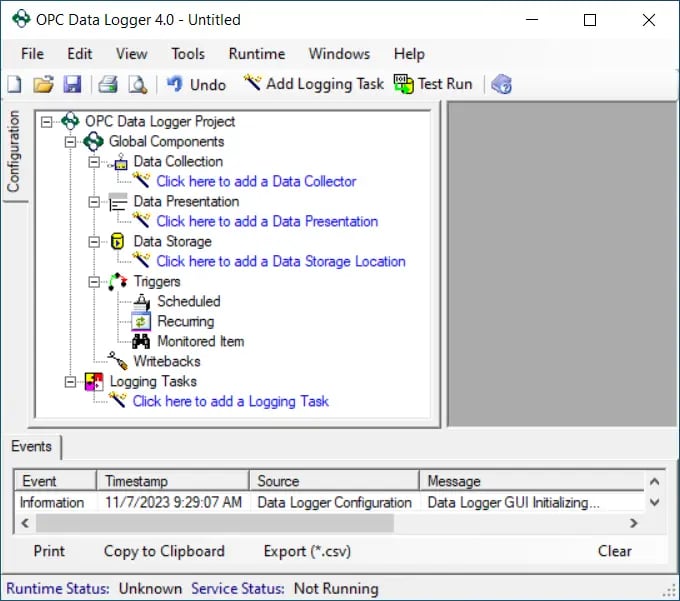
This is your home base. It’s the interface you’re probably the most familiar with if you’ve used OPC Data Logger before, and the application that a lot of people think of when we talk about OPC Data Logger.
This is where you'll configure the logging settings. Our users tell us the best way they’ve found to configure the OPC Data Logger is by leveraging the magic of wizards. And no, we’re not talking about sorcerers. We’re talking about the OPC Data Logger’s Configuration Wizards.
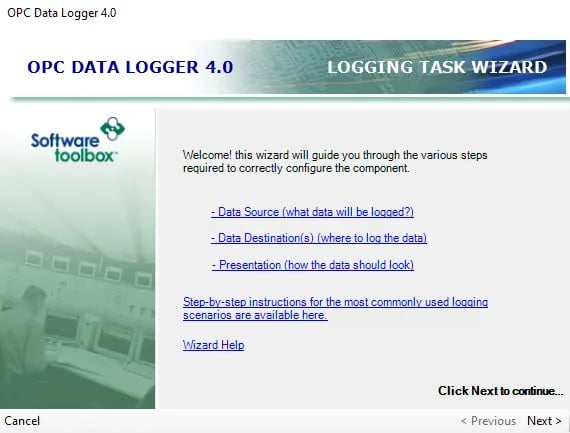
When you launch the OPC Data Logger Configuration, or start a new project, you will be met by a wizard.
The wizards help simplify the configuration of the OPC Data Logger application by guiding users through the required steps to configure each component. They can be turned off at any time by going to Tools –> Options, and setting “Auto-launch Wizard” to False.
The following components currently have configuration wizards because they are the required components for successful logging:
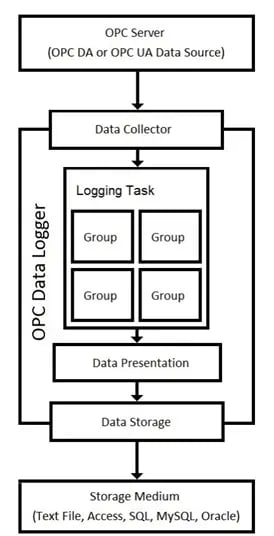
- Data Collector – Where is the data coming from? This is going to be your OPC DA or OPC UA Server, like our TOP Server or OmniServer offerings. This could also be a device or PLC with an embedded OPC Server interface.
- Data Storage – Where is the data being logged to? Text/CSV File, SQL Server, Oracle, MySQL, MS Access, or ODBC.
- Data Presentation – How do you want the data to look? We support Table Mode, where every column holds a single tag’s values with the first column being the Timestamp, and Detail Mode, where each row contains multiple attributes for a single tag.
- Logging Tasks – Bring it all together! This links a Data Collector to a Data Storage and contains Groups of OPC Items to be logged.
There are other optional configuration components without wizards shown below. These options can be assigned manually once the wizard configuration process is complete.
- Triggers - When should logging start/stop? When should file spanning occur?
- Writebacks - Configure the OPC Data Logger to write a value back to a tag in the OPC Server.
As the main user interface for OPC Data Logger, the configuration application houses many of the important interaction points for users. This includes the licensing mechanism, event log, access to the help file, administrative and runtime settings, utilizing the test-run feature, and more.
Service vs Runtime
The OPC Data Logger Service is the main engine that handles the collection of industrial data for archiving into files and databases. Within the OPC Data Logger, the Service and Runtime are two separate things.
While the Service is the main engine that handles Data Logger operations, the Runtime is what determines whether those operations should be active. Basically, it’s an On/Off switch that hooks the Configuration and Service into each other.
Because the OPC Data Logger Runtime relies on the Service, the Service needs to be running to log anything at runtime. Because of this, you should be mindful of the order of operations when starting or shutting down the OPC Data Logger. You must turn the service on first, then the runtime. When shutting down your Logging Task, you should stop the Runtime before the Service.
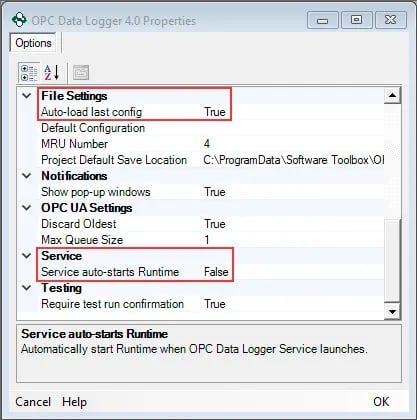
The Runtime can be started or stopped from the Configuration and from the Notification icon (details in next section). It can also be configured to start automatically by the Service under Tools –> Options –> Service, and setting “Service auto-starts Runtime” to True.
Another thing to be aware of that relates to the Service and Runtime is that by default, the last saved configuration is automatically loaded when the OPC Data Logger Runtime is launched, but this can be disabled by going to Tools –> Options –> File Settings and setting “Auto-load last config” to False.
The OPC Data Logger event log will notify you when the Runtime or Service has been started or stopped. In addition, at the bottom of the Configuration window, you will see the status of the Runtime and Service. When the Runtime is Active, it will also show the Config file that is loaded with its saved location.
![]()
Notification Icon
“DataLogger Notification” is a background process that runs from the System Tray and provides notifications based on the status of the OPC Data Logger. It is represented in the System Tray by the Software Toolbox logo with an overlayed status icon.
The following actions are available when right-clicking on the Notification icon:
- Start/Stop Runtime – Controls the Runtime, but needs the Service to be running
- Configuration – Launches the Configuration window
- Start/Shutdown OPC Data Logger Service
- Exit – Shuts down the Notification program
The following status icons may be shown:
 Play means the Runtime and Service are both active and running.
 Pause means the Service is running, but the Runtime is not.
 "X" means the Notification has its lost connection to the Service.
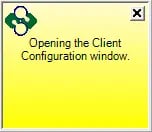
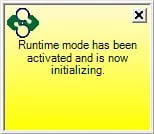
The Notification icon will display certain messages relating to the OPC Data Logger status and operations. Here are a few examples:
 |
 |
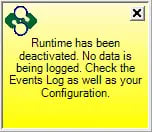 |
The notification messages are clear and self-explanatory. Because of this, the Notification icon adds another layer of usability and makes it easy to control the OPC Data Logger operations and be aware of its current status.
Conclusion
We hope this outline of how the different OPC Data Logger parts work together was helpful and has prepared you to get the most out of your usage of the OPC Data Logger.
Want to dig deeper into what OPC Data Logger can do? Check out our other posts on OPC Data Logger and browse our OPC Data Logger Training and Tutorial Videos. As always, if you have any questions, please contact our team for help.
And lastly, don't forget to subscribe to our blog to find out about the latest updates for OPC Data Logger and for other how-to videos on using OPC Data Logger and our other Software Toolbox solutions.
Ready to try OPC Data Logger for yourself? Download our fully-functional free trial.


