In the industrial automation industry, more and more companies are looking for ways to increase profitability through minimizing downtime and the lost productivity associated with it.
In this blog post, we discuss how actively monitoring and tracking downtime occurrences can empower you to reduce or even eliminate such productivity-killing situations.
Traditionally, the majority of downtime tracking applications have involved monitoring a machine or piece of process equipment for tell-tale reasons that it's shut down. Such downtime can be caused by many conditions, some expected and some unexpected.

The goal of any downtime monitoring solution should be to identify the reasons for downtime and then categorize and analyze those reasons by quantity and duration. Such qualification of the typical reasons a certain piece of equipment tends to go down provides operators and plant management with invaluable actionable data about where most failures tend to occur.
As such, those decision makers can drive continuous improvements to the usage and maintenance of that equipment, thereby reducing downtime and improving overall equipment effectiveness (OEE), where downtime is a huge factor.
Downtime events are almost always collected through direct communications with process machines and equipment. A condition, which is usually nothing more than a digital signal, will warn of the start of a downtime condition. That same signal or another similar corresponding signal will identify the end of that downtime condition. During tracking of that machine's downtime, relevant variables will be collected and archived for downtime reports and dashboards that can be used by decision makers for further analysis.
While less common than direct collection, downtime conditions can also be entered manually to create a database of events and data to analyze for equipment that may not be connected to the process network for automatic collection. Such manual data, though less than ideal, is still an important step to paint the overall portrait of health in that process.
What Data Typically Needs to Be Collected for Monitoring a Process Downtime Event?
The key variables normally collected when tracking downtime for a piece of equipment are as follows:
- Start Time of the occurrence
- End Time of the occurrence
- Operator Name
- Lot IDs or Product Serial Numbers
- Machine Component IDs (Mold IDs, Tool Information)
- Key Control Variables (Temperatures, Pressures, Cycle Counts, etc)
- Reason Codes for Downtime Reasons (automatically collected or manually entered)
Such relevant variables are collected and analyzed for improving the machine utilization (i.e. reducing downtime), but also for quality improvement, to minimize situations where product involved with downtime instances might be scrutinized with respect to its integrity or in the worst case, recalled in the future.
What Calculations are Typically Performed for Downtime Monitoring?
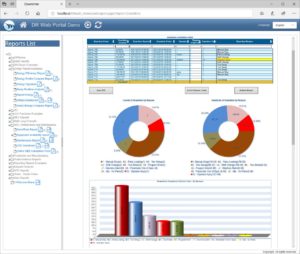
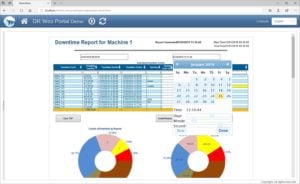
The most common calculations utilized during downtime analysis are counts by specific downtime reason and the accumulated amount of downtime by reason. With an understanding of associated costs, the above variables can be used to express in downtime in relative currency values (Dollars, Euros, etc.). These are commonly visualized using pie charts and Pareto charts.
Another normal calculation to perform would be downtime statistics by specific operator or downtime statistics by specific type of part. If any trends become apparent in greater downtime for a particular operator, there is a higher probability that a human factor might be involved that can be corrected. Or, if one specific part is show to have a higher instance of downtime due to design, hardness or another attribute, steps can be taken to remedy that downtime either through a redesign or other method.
Such common analyses can be performed over any period of interest and may also be automatically generated after a product batch or shift. Results could be displayed in a browser-based portal for management to see, and even displayed near machines, on big screen TVs to drive continuous improvement on the plant floor and awareness of current machine statuses.
How Can Dream Report Help with Downtime Tracking?
Dream Report is an ideal tool for meeting downtime analysis and reporting needs. There is even a special option for Dream Report, the DBATCH option, that facilitates monitoring real-time conditions and sensing the start and stop of any condition.
Often also used for batch reporting, where reports and dashboards are automatically created based on product manufacturing batches, the DBATCH option is just as effective at monitoring downtime conditions.
DBATCH will uniquely label each downtime instance based on a user-defined naming convention. DBATCH will also log starting and ending date/time information, as well as, capturing any number of relevant variables such as those mentioned earlier that are valuable in the case of downtime reporting.
And all information is then stored in a relational database. The relational database of choice, which can be virtually any ODBC-compliant relational database, is specified by the user during system setup. Dream Report automatically creates a database with associated tables for data storage in that relational database. This RDB repository becomes the source of downtime data along with any other data repositories that may already exist and be connected to Dream Report for other analysis purposes.
And, perhaps most importantly, Dream Report can effectively be considered an additional resource, like a new employee. It runs autonomously, in the majority of downtime reporting scenarios where all equipment to be monitored is on the process network and connected. Given the cost of a single hour of downtime in many processes, machine and equipment downtime monitoring and tracking can normally result in a full return on investment relatively quickly as analysis results in fewer and shorter downtime occurrences.
Want to get started reducing your process downtime with Dream Report? Download the free trial.