We all love it when things go according to plan, but realistically that’s not always the case. Inconsistent device documentation and confusing protocol specs can make custom protocol implementation for devices that don't use standard communications protocols daunting, and although OmniServer is significantly easier than custom code solutions, there are still a lot of details to attend to!
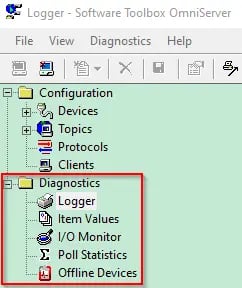
So, what happens when things aren’t working as you hoped? With OmniServer, our users rave about its simple but powerful diagnostics tools and how they make troubleshooting communication issues a breeze. In this blog post, we will examine the five diagnostics tools available within OmniServer: the Logger, Item Values, I/O Monitor, Poll Statistics and Offline Devices. Our own technical team uses these same diagnostics when we are helping you during or after implementation.
 Throughout this article we will reference the main components of the OmniServer configuration, so if you are not familiar with these, we recommend taking a look at our previous post on Exploring the OmniServer Configuration before you continue reading.
Logger
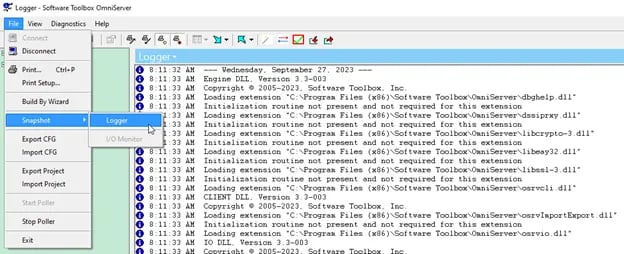
The Logger is the "event log" for OmniServer. This tool is used to display internal server information such as errors, events, sends, and receives of data in OmniServer. This is a perfect location to check for errors regarding device communications. Each line will contain a icon showing what type of information is contained on the line, a timestamp, and a text description of the event. The most recent logs will be shown at the bottom of the Logger, and older entries will be replaced with newer ones as the Logger reaches its capacity.
You can export the current Logger events to a text file by navigating to File -> Snapshot -> Logger and selecting a location to save the file. The file can hold a number of entries based on size, and as long as you are on version 2.6 of OmniServer or newer, this size can be configured between 64 and 999 KB.
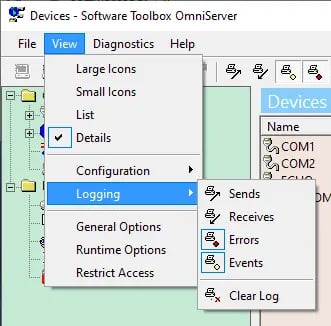
You can choose the event types seen in the Logger and exported to the Snapshot by going to View -> Logging. By default, only Errors and Events are selected.
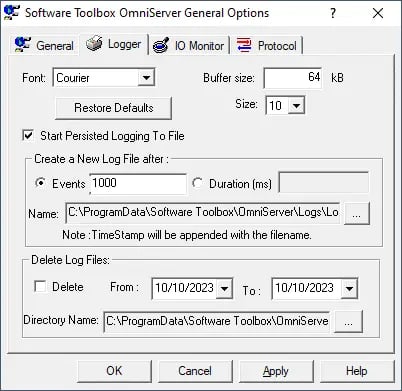
You can also enable persisted logging to a text file by navigating to View -> General Options -> Logger. This is something that is usually only enabled when working with our Technical Support team to troubleshoot a hard to capture in action issue. Persisted logging can affect performance so it's best to not leave it running all the time.
In addition to the Persisted Logging settings, this property window is also where you would go to adjust the Buffer Size of the Logger (64 -999KB), as well as the Font Style and Size of the Logger entries.
Item Values
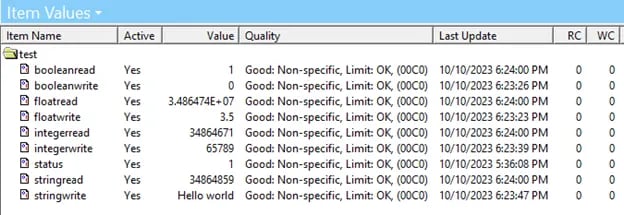
The Item Values window displays a list of all items, what you may refer to as tags, that were created in the protocol and are actively being requested by a client application, such as your HMI, SCADA, Historian or MES. It will also show items that have been automatically activated by the protocol, meaning OmniServer will automatically activate the item (or make the item available) when a client first connects to the server. This means the item will be listed even if a client is not actively requesting it. This is a setting that is disabled by default within the protocol editor.
All items are grouped by Server Topic. There are several columns that provide information regarding each item:
- Active: Set to "Yes" if the item is being actively requested by the client. Set to "No" if the item has been automatically activated by the protocol but not requested by the client. If you are having trouble communicating with your device from your client, this should be the first place you look to determine if a client is even connected to OmniServer.
- Value: The value of the item. This column will say "Not Set" if the item has not been initialized with data from the device, by a client application, or by the server through an initial value setting in the protocol. While OPC Classic (DA) and UA allow it, some client connections such as DDE and SuiteLink do not support the concept of having no value. This is a limitation of the client transport. Thus, until an item has an actual value, nothing will be sent to the client. Even if the quality of the item is known, nothing will be sent. One way to work around this problem is to set an initial value for the item within the protocol.
- Quality: The quality of the item point. This is used in OPC and SuiteLink Communications.
- Last Update: The last update time is the last time the value was modified OR polled. However, some client transports such as OPC might not send the last update time to the client if the timestamp changed, and the actual value has not.
- RC: Number of pending Read operations for this item.
- WC: Number of pending Write operations for this item.
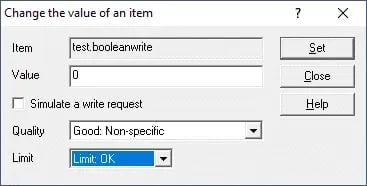
In the Item Values window, you can also double-click on any item to change its value. Here, you can set a new value for the item, but “Simulate a write request” will only work if there is a write message configured for this item in the protocol.
I/O Monitor
The I/O Monitor is used to show the raw data being processed by OmniServer. This includes the data generated by the server and sent from the device. The I/O Monitor displays both Hexadecimal and ASCII representations of the same data bytes, making it easy to interpret what has been sent and received. It is perfect for comparing the data received from the device to the messages configured in the Protocol if the data is not being processed as it should be. This data is color-coded to clearly show what data is being sent and received to help identify if any problems are occurring during communication. OmniServer, by default, is color-coded in the following way:
- Black Data - This is always going to be data that OmniServer has sent to the device. This would be the Request portion of the Host Messages or the Response portion of an Unsolicited Message in the Protocol
- Blue Data - This is received data that has not been processed. This normally means that the Response portion of a Host Message or Received portion of an Unsolicited Message in the Protocol does not match the pattern of data received by OmniServer. It will always turn into one of the colors below (unless no more data is received from the device).
- Green Data – This is received data that has been successfully processed and matched to a message in the Protocol, allowing the data to be parsed into any configured Items.
- Magenta Data - This is received data that has been processed but did not match any message in the Protocol. This means that there is at least one byte in the Response or Received sections of the messages in the Protocol that does not exactly match the pattern of the data being received.
- Red Data – This is received data that was blue or magenta but also failed an Error Detection Code (EDC) check. This would only ever be possible if the device uses Error Detection Codes such as a checksum.
When viewing the I/O Monitor, if only black data is shown, and a device response is expected, then the commands being sent to the device are not being interpreted correctly or there are problems with the connection settings for the device, or possibly the protocol message itself.
Another issue to be aware of is that if you are only receiving magenta, blue, and/or red data back, the device is responding, but the message pattern does not match what is configured in the protocol response messages.
All green data being received back from the device means that your protocol is correct, and the device is responding. This is what we want! Let's look at two examples of different scenarios.
Scenario One
In the image below we see the black data that has been sent to the device, but we have blue and magenta data being returned.
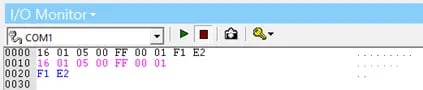
This means we have:
- Data that has not been processed, shown by the blue data.
- Data that has been processed but did not match a response in the protocol, shown by the magenta data.
Scenario Two
In the image below we see the black data being sent to the device, but this time we receive green data back, meaning it was successfully processed.
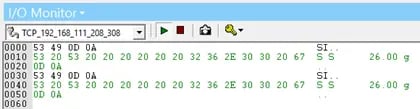
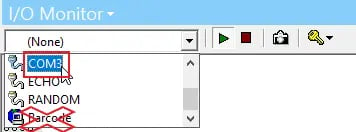
Note: When using the I/O Monitor, be aware of your device selection for viewing the data. This selection is made using the drop-down box from the menu bar in the image below.
- We recommend selecting the Device instead of the Topic.
- Choosing the Topic will cause the I/O Monitor to only display good data. So, if there are issues associated with the protocol, the blue, magenta, or red data will not be shown.
- Conversely, if the device is chosen, all data will be shown, good or bad, regardless of color.
- It is more useful to select the Device and view all communications between that device and OmniServer.
The I/O Monitor also has a useful snapshot feature for saving the data to an HTML file. Because the data is exported as HTML instead of TXT, the color-coding is maintained. Like the Logger snapshot, the I/O Monitor snapshot can help provide insight to our technical support team if you need assistance troubleshooting. You can utilize this convenient feature by clicking on the camera icon from the menu bar shown above, eliminating the need for external snapshot tools.
Poll Statistics
The Poll Statistics window displays a set of statistics for each Server Topic and Device available. The items are grouped by both the Server Devices and Server Topics. There is also a group in this window that displays a handful of system level items, including the number of clients currently connected. When connected to a client, you will see the items in the Poll Statistics window update in real-time.
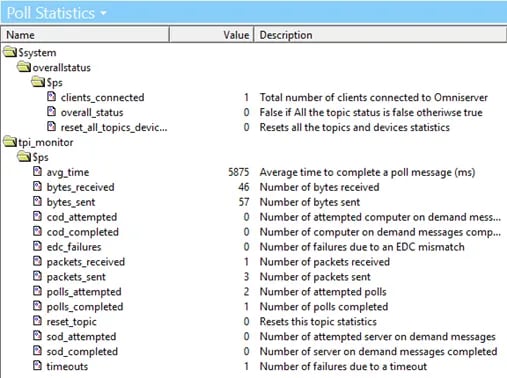
You can also access these items from your HMI/SCADA/Historian/MES application to monitor the OmniServer Communication with the device for any associated issues that could be occurring. To access each item, the address will be comprised of the name of any containing folders and the name of the item, each separated with a period.
For example, if I wanted to add the bytes_sent item from the image above, in my client I would add an item with the address: tpi_monitor.$ps.bytes_sent. This would then allow me to see the live value for that item within my client application.
Offline Devices
The Offline Devices window provides a way to manage troubleshooting by displaying only devices that are having communication issues. You will see a reason associated with any device being offline that corresponds to an error in the Logger for that device.
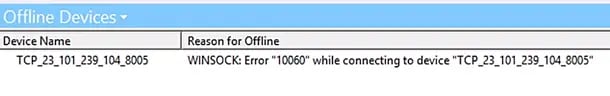
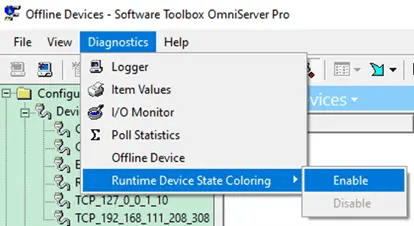
Note: If you are using the Runtime Device State Coloring feature, any device having communication issues will be highlighted in red and correspond to the Offline Device window. To enable the Runtime Device State Coloring feature, go to Diagnostics -> Runtime Device State Coloring -> Enable.
Now we've covered the five components of the OmniServer Diagnostics section. As you can see, the Diagnostics tools within OmniServer are extremely useful for viewing communication details with your device, reducing the time, frustration, and cost when implementing custom protocol configuration and communication troubleshooting.
For more details on how to put these tools to use, please view our OmniServer Help File and User Manual and our guide for Troubleshooting Communication Problems with OmniServer.
To see the many reasons why OmniServer may be right for you, please visit our page on OmniServer Concepts, and if you are new to OmniServer, please use our OmniServer Video Resources to help you get started.
While you are now empowered to diagnose and solve your own issues, always feel free to contact our support team if you do require any assistance, and don’t forget to subscribe to our blog to find out about the latest updates on our products.
Ready to get started connecting your own non-standard devices? Download the fully-functional free trial.