In this blog, we will cover the built-in startup and testing features included in the TOP Server including a video link to see these tools in action.
These tools include a sample OPC client that can help with quickly testing connectivity to your devices, as well as device-to-server level and server-to-client level communication diagnostics. The user interface displays important informational messages, as well as communication warnings and errors. Also available is extensive and easy to navigate help documentation.
We’ll briefly discuss each of these tools and take a look at a video which walks us through the use of each of these tools and points us to further troubleshooting resources at Software Toolbox.
With the easy configuration and defaults provided by all TOP Server communication drivers, with many projects it's possible to get up and running without ever needing to use the diagnostics and troubleshooting capabilities included with TOP Server. However, it's important to be familiar with what your options are for troubleshooting when and if an issue does arise. Below, we detail the five important tools available in TOP Server to make finding and resolving any issues much easier.
1. OPC Quick Client
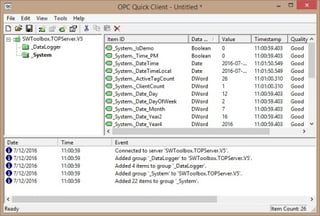 Let’s start with the OPC Quick Client. The OPC Quick Client is a sample OPC DA client that can help you test connectivity to your devices. This is an important tool because it can be used to help isolate problems between TOP Server and the device, versus problems between TOP Server and your client configuration. OPC DA returns quality codes as well as values for tags or items requested. A list of these codes can be found here.
These quality codes can be helpful when testing as well; if you are seeing bad data quality or incorrect values in your client application, one of the first things you can do is try connecting to TOP Server with the OPC Quick Client. If you can see values changing with good quality in the OPC Quick Client, you can rule out the connection between TOP Server and the device, as well as the device specific settings in TOP Server, and instead focus on the connection between TOP Server and your client.
2. Event Log
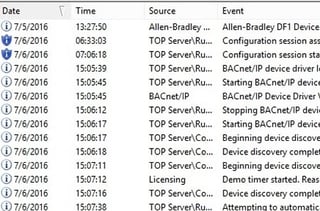 Now let’s talk about the TOP Server event log. The Event log is the first place to look if you think you are having communication problems. The Event log includes messages for any communication errors between the server and the device as well as informational messages. On start-up, the drivers in use by the project are loaded and displayed in the event log including the version numbers.
Also, a demo timer entry is logged if the TOP Server is not licensed or if an unlicensed driver is used in the configuration. There are currently four types of events that can be recorded:
- Error Events include error messages, such as the rejection of bad OPC, DDE or Suite Link item requests.
- Warning Events include warning messages, such as "Device not responding" or errors returned by the device.
- Information Events include server startup and shutdown messages including driver loading as covered above.
- Security Events include security messages like when the configuration updates the runtime engine, so change timing can be tracked. If the User Manager features are used, the event log will record who is logged in when changes are made to the runtime or the configuration is saved for audit purposes.
3. Help Files
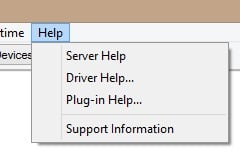 The TOP Server installs two different types of help file - the server help file and the specific driver and plug-in help files. The TOP Server help file includes information on the TOP Server in general, such as features, options, project property settings and error descriptions.
If you are looking for specific information on the behavior of a particular driver or driver specific error messages you need to look at the driver help file. The Event Log will give some indication if the error is server or device specific to help with determining which help file should be consulted.
4. Communication Diagnostics
The TOP Server communication diagnostics allow you to capture the protocol packets that are being transmitted and received between the server and the device. This allows us to verify that the expected sends and receives are occurring for a particular protocol. These can be saved as a text file and sent to support as well.
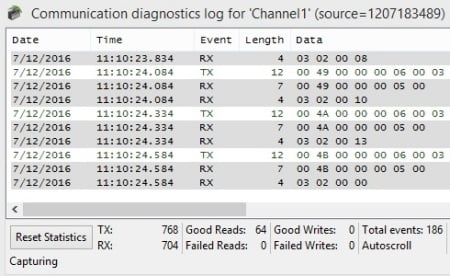
In text format, the send and receive timestamps can also be seen to help determine where delays in communication may be happening. The bottom of the diagnostic window also shows the number of sends and receives and if they are successful or not.
These values can also be monitored in system tags in your client application and even be reset via a special system tag. Click here for a complete list of these systems tags and how to connect to them.
We also have a useful video and step-by-step instructions for how to use these device diagnostics - click here to access the video and how-to.
5. OPC Diagnostics
Currently, the OPC diagnostics can only be utilized if your client application is making an OPC DA connection to the server. It captures the OPC requests and responses between the client and the server to show the OPC calls being made. An event is a method call that a client makes to the server, or a callback that the server makes to a client.
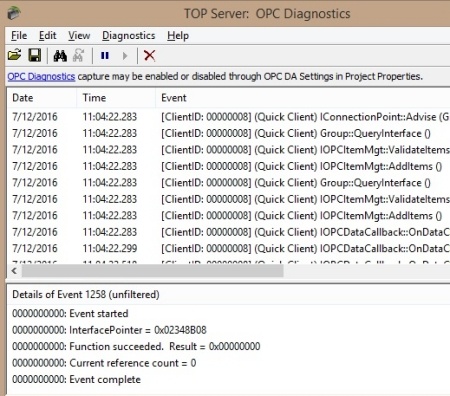
These diagnostics capture the details of each function call between the OPC client and TOP Server, including the value, quality and error codes. These can be saved and sent to support to help determine if an OPC Client is sending the expected calls and if the TOP Server is responding as expected.
This is often used when unexpected values are being displayed in the client or if values are not updating as expected. If you have these kinds of problems our support team can provide clear instructions on how to save off the file as needed.
Currently, OPC UA diagnostics can be captured using Wireshark, so please contact us in these cases so we can explain this method.
For Wonderware SuiteLink connections, tag quality and value changes have to be monitored for troubleshooting (also, Wireshark can sometimes be used here as well).
Now that we've familiarized you with the available troubleshooting tools, please take a look at the following video introducing you to basic troubleshooting techniques within TOP Server using these tools.


