With industrial processes, it's only possible to manage what is being effectively measured. Without keeping tabs on key metrics in a process, you'll never be able to determine if the efficiency of the process is getting better or worse.
In this short blog post, we'll discuss the progression from raw process data to information to the actions that can be taken and decisions that can be made using that information. We'll also discuss how the context (or how you're looking at data) can affect the information you're consuming.
Something that is true for virtually any industry is that, unless you measure something, you will never know whether it is getting better or worse. You cannot manage a process with improvement in mind if you cannot see what you are trying to improve and what your progress is towards that improvement.
What Counts as a Source of Raw Process Data?
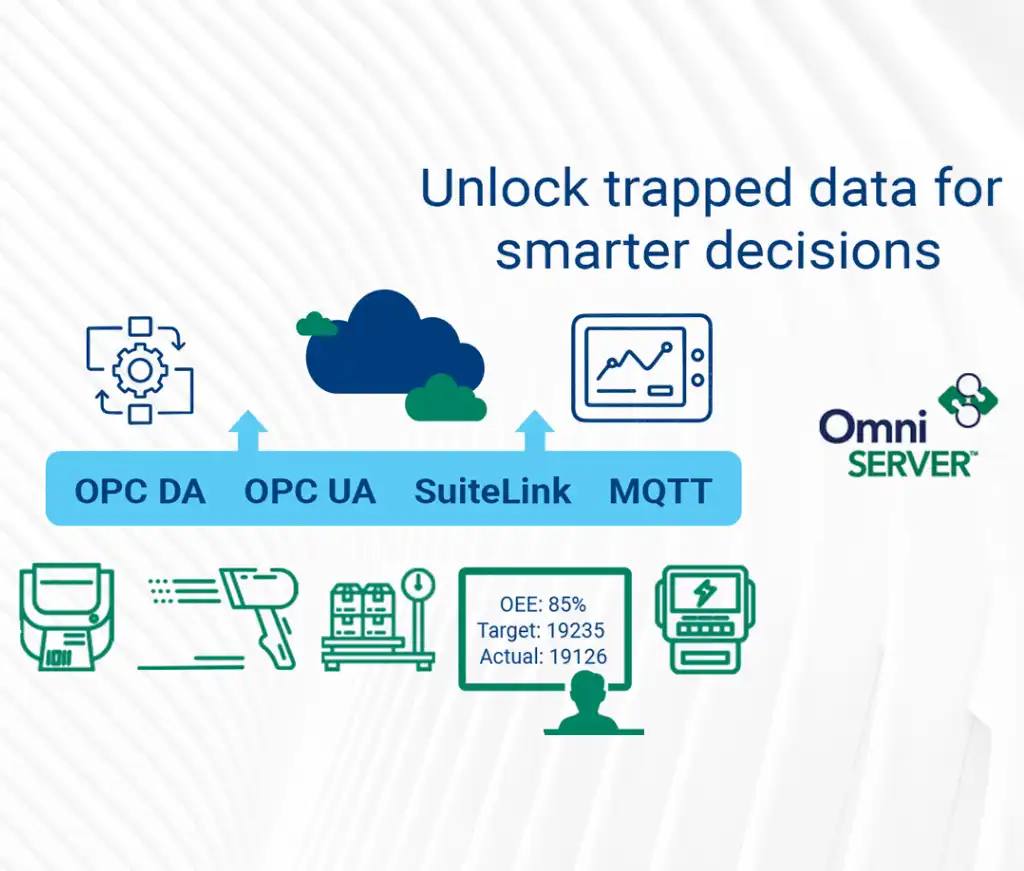
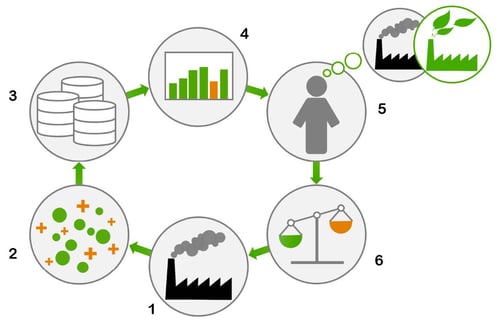
The diagram below illustrates your production facility ①, which produces vast amounts of data ② about your processes. This data, in some form or another, is stored in one or more data stores ③. In many cases these data stores are simple databases, like Excel, but in other cases they can be any of a number of industrial data Historians, such as Wonderware Historian. Even TOP Server for Wonderware with Local Historian can be a data source.
How Can You Turn Raw Process Data into Information?
With the huge volumes of data that are collected in virtually any historical data store, it's very important how we “see and understand” this data. It's not uncommon to think this requires “Advanced Analytics” or “Statistical Processing”, but such powerful (and often complex) tools are not always necessary.
There is a much simpler and increasingly valuable option - effective data visualization ④. Applying basic data visualization best-practices provides a quick and accurate understanding of the data ⑤. This understanding creates a “picture” of how the production facility is performing – a “picture” that can be compared to your organization’s goals, which makes it easier to see any deficits.
How Can Process Information Be Used to Take Action?
Determining how and when to take action can be as simple as making a comparison of actual performance to organizational goals (which every company should have defined) allows for better and more frequent decision making ⑥, which affects the production facility. The more quickly and accurately information can be gleaned from the raw process data ④, the faster the cycle of informed and effective decision making can be implemented, thus enabling the organization to achieve its goals in the most efficient manner possible.
To that end, let's take a look at some best practices involved with putting data into context simply by looking at it in a different way, thereby turning it into actionable information.
How to Look at Raw Data and Understand it More Quickly as Information
Here is an example of how raw data can be understood more quickly.
How many 3’s can you see in this string of numbers? How long does it take you to count them?
963452783986731258/64645213215198131321324984798/161316876984161651684
Manually processing such a string of data is not only time consuming but there is a very real possibility you'd get the count wrong anyway. Let's look at the same data in a different context.
963452783986731258/64645213215198131321324984798/161316876984161651684
Notice the difference?
The use of color and underlining here helps put the data we're actually interested in into better context, allowing us to easily distinguish the 3’s from all of the other numbers. Your brain “automatically” processes this data, requiring much less effort and greatly increasing the speed.
This example not only demonstrates how many 3’s there are, but also the distribution or pattern of 3’s within the string of numbers, which can also provides additional information. Using color or differentiation to display information is, as such, a key data visualization best-practice.
How to Look at Raw Data and Understand it More Accurately as Information
Here is an example of how raw data can be understood more accurately.
Pie charts are an incredibly popular visualization tool in reporting situations, but which of the slices in the graph below, A, B or C, is the biggest? How much bigger is it than the other slices?
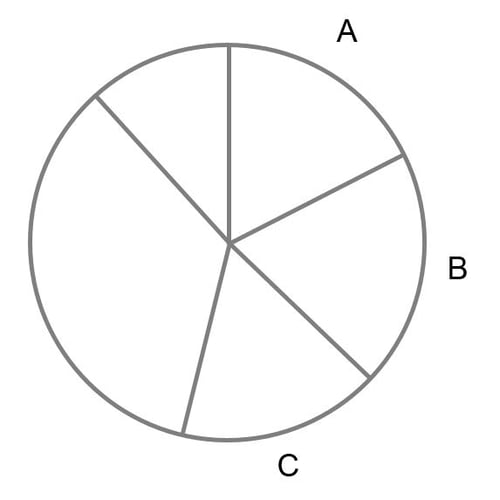
Your brain’s visual cortex is not so good at “seeing” angles, so it's hard to determine specific metrics when looking at something like a pie chart. But if we put the same data in a different context...
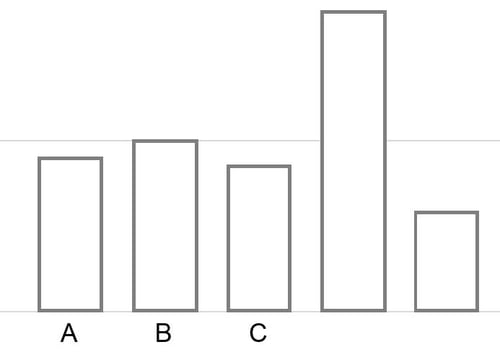
Which bar, A, B or C, is the biggest? How much bigger is it than the others? Encoding the raw data in this way allows us to more accurately obtain the information we need. In this way, using size rather than angles is another key data visualization best-practice.
How Can I Apply Data Visualization Best Practices to My Process Data?
FLOW is a powerful data collection and calculation engine that prepares information using your process data for presentation and integration. By employing data visualization best-practices, FLOW transforms your measured data into information that is understood quickly and accurately, allowing frequent and effective decisions to be made.
If you're interested in measuring the success of your processes and making decisions to reach your organization's goals, just take a look at what FLOW can help you do with your process data.