You may or may not be aware that our technical support team at Software Toolbox maintains, updates and adds new content to an extensive knowledge base built from answers to all of your questions from over the years. We like to frequently review which of our knowledge base articles have been used the most to see what users like you need help with and what is most relevant.
Continuing our Tech Support Corner blog series, this blog post covers the why's and how's of using the popular and powerful network analysis tool called Wireshark as an additional tool in your troubleshooting arsenal.
What is Wireshark?
If you've never heard of it before, Wireshark is a freeware packet-capture utility. Basically, Wireshark can capture all of the packets sent or received by a PC's network interface card (NIC). We find the depth of information that Wireshark can collect to be invaluable in troubleshooting when Ethernet communications are involved.
Why use Wireshark with products with built-in diagnostics?
You may be familiar with several of our common communication server solutions such as OmniServer or TOP Server and be aware of the fact that they include integrated protocol diagnostics capabilities. These integrated tools are powerful, as well, allowing you to capture protocol level transmits (TX) and receives (RX) along with date and timestamp information. Since the integrated tools isolate what is captured down at the protocol level, they are ideal for troubleshooting things like whether a device is sending the correct value for a variable or seeing how long a response took from the time the transmit was sent.
Then we have situations where there may be issues above the protocol level of communications (for instance, in the TCP link layer). In those scenarios, Wireshark is the go-to solution for our support engineers when they need a little more information than just protocol sends and receives (such as the TCP level calls that establish or breakdown a connection, for example).
Wireshark can even be used for filtering and viewing un-encrypted OPC UA traffic - if you missed our blog post on how to use Wireshark for OPC UA, click here.
If you don't already have a copy, the latest version of Wireshark is available for free here.
Once you have a PC that can monitor packets sent to and from the devices to be tested (if you're a Software Toolbox user, it could be your OmniServer or TOP Server machine, for instance), and you have installed Wireshark on this PC, you can start a network capture.
How to Perform a Wireshark Capture
The first time you start Wireshark, select the menu option Edit | Preferences. This will open the dialog below.
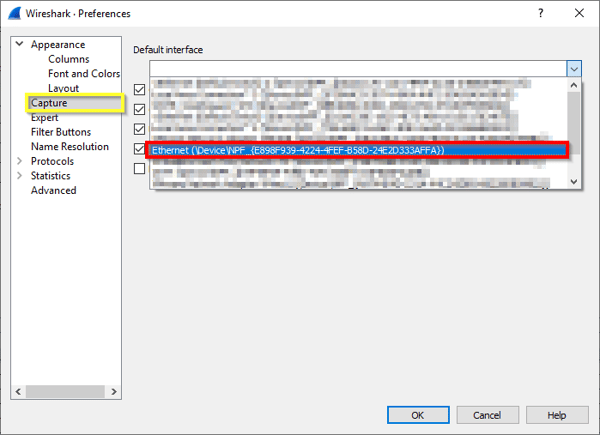
On the left, select Capture (outlined in yellow in the screenshot above). Then select the Ethernet adapter you’re using (outlined in red). Then click OK.
Before you start the capture, you can select Capture | Options in the main menu, bringing up the dialog below:
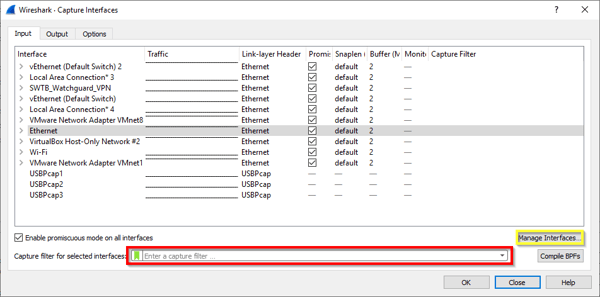
In the Capture filter... field shown above (outlined in red), you can greatly decrease the amount of packets that are captured (and that you have to wade through) by applying an optional capture filter. Capture filters can be applied here before the trace begins by adding the appropriate syntax to the field. Using a capture filter is recommended for high-traffic networks or for long-term capturing. During short capture periods for low traffic interfaces, there may be scenarios where filtering after the trace completes is appropriate since there is less chance of your capture size getting very large. Post capture filtering does not alter the contents of the trace, it merely limits the view which is useful if you're not quite sure what specific traffic you're looking for.
Filters are application specific and will not be covered here. For help on capture filters, you can click Help in figure above, then go to the Capture Filters tab of the help viewer for extensive details on supported filters and the correct syntax you should use.
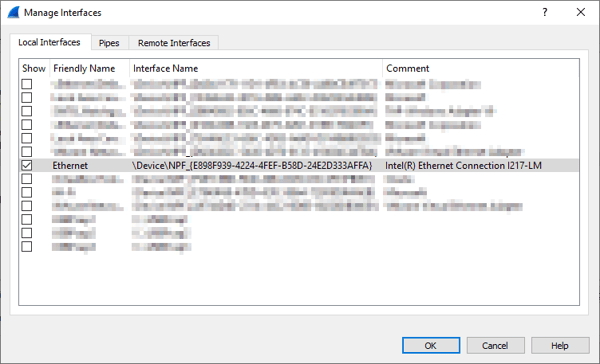
Also, in most cases, you will want to limit your capture to a specific interface. This decreases the amount of data you need to sift through that isn't relevant to the issue you are troubleshooting. Click on the Manage Interfaces… button (outlined in yellow above) and disable all interfaces that you are not tracing, as shown below.
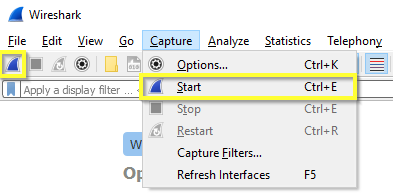
Now that your desired NIC for the capture is selected and any pre-capture filters have been applied, you're ready to start the Wireshark capture. Click the Start button on the Toolbar or select Capture | Start from the menu to begin your trace.
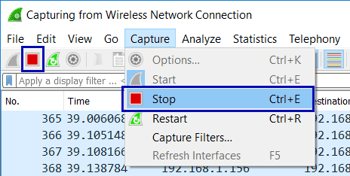
Let the trace run until you've observed the problem behavior that you're trying to diagnose, then stop the capture by either clicking the Stop button on the Toolbar or select Capture | Stop from the menu, as shown below.
For a more detailed introduction to using Wireshark that goes beyond what we cover in this blog post, make sure to take a look at our Introduction to Wireshark Network Analysis whitepaper, available in our knowledge base.
Don't forget to subscribe to our blog to find out about the latest updates to TOP Server and for other useful tutorials and resources, including more Tech Support Corner posts each month.