Your operations visibility relies on real-time data from machinery, systems, and field devices. When there are communications issues resulting in loss of or inaccurate data, addressing issues promptly is critical. Whether it's stale, poor quality, or missing data in your SCADA or HMI application, a well-defined troubleshooting procedure is a must. Like all our products, the TOP Server OPC Server offers an arsenal of tools to inform you about what is happening and streamline your troubleshooting process, summarized in our previous blog post, Minimize Downtime with TOP Server Troubleshooting Tools.
In this post, we'll take a deep dive into some of those tools, with an emphasis on the device connection side of TOP Server, teaching you a step-by-step process to pinpoint communication issues at their source. While this specific example uses the Modbus Ethernet Driver and an OPC DA Client connection, the same principles can be applied when troubleshooting various other scenarios.
First, let's consider the Event Log
The initial step in troubleshooting almost any problem is to collect information. This information could include the potential causes of unexpected occurrences, associated symptoms, or specific conditions necessary to replicate the issue. TOP Server's comprehensive Event Log is a valuable troubleshooting resource that logs informational messages, warnings, and errors when issues arise. This holds true for configuration issues, client-side problems, and device-side communication challenges. A thorough examination of the TOP Server Event Log can offer valuable context for the issue at hand, making it an ideal starting point.
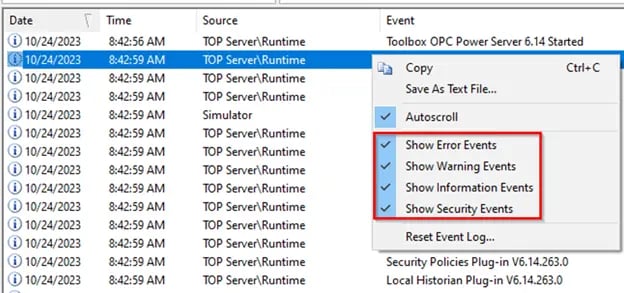
As covered in our previous blog post, the Event Log records four types of events: Errors, Warnings, Information, and Security. By default, all possible events will be logged. If you don't really need to see some event types, you can easily hide them by right-clicking on the Event Log and unchecking the event type as shown below. This does not stop the logging of the events, but filters the view.
A common use case would be to filter on errors and warnings when trying to solve a communication problem. It is recommended that you leave the view to show all events to start so that you get a full view and then narrow your focus.
The Event Log also provides the Date, Time, and Source of each logged entry, which can be used to determine answers to questions like...
- “When did this issue start? Has this been a long-term issue we didn't notice or was there a recent change that occurred around the same time the problem was reported?"
- "Are we receiving an error from the device?"
- "Is there a problem in our TOP Server configuration?"
- "Is our license functioning as expected?"
The source of the error shows which TOP Server component is reporting the issue. Below we can see four examples of error types with explanations of each
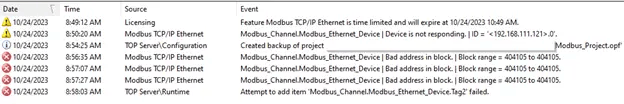
- Licensing: Entry informing of a possible license limitation or issue. TOP Server drivers that are in use but not licensed will stop working after 2 hours of communications. The event log will log a Warning event with a yellow triangle icon as shown in the first entry above.
- Navigate to the TOP Server License Utility by right-clicking on the TOP Server icon in the system tray and going to "License Utility."
- Look at your licenses - in the use case above the Modbus TCP/Ethernet driver is not licensed.
- Modbus TCP/IP Ethernet: This is a driver specific entry. The issue may be in the configuration of the Modbus TCP/IP Ethernet Channel or Device or the device may be offline, or there could be a network problem. Refer to the "Driver specific" help file for direction.
- Navigate to the Driver help file by going to "Help" > "Driver Help..." in the TOP Server configuration. Here are short explanations of what you see above.
- Device Not Responding or "DNR" for short, means we have sent a valid request to the specified IP and no valid responses have been received in the timeout period * # of retries setting.
- Bad Address in block means that a tag has been requested for an address that does not exist in the device. With Modbus devices, some will reject the message if you request a bad address in a range, others will return a 0 value. The latter avoids an error message but can be misleading, but is not in our control, that's how the device works.
- Attempt to Add Item Failed - means a client requested a tag that does not exist in TOP Server.
- TOP Server\Configuration: Any entry pertaining to a change or issue with the project itself. Typically, informative. Review event to determine if action is required. In the example above, an entry was logged when a configuration backup was made.
- TOP Server\Runtime: Server specific entry related to the TOP Server runtime service (or process) presented during execution of device communication, plug-in operations, and upstream client communication. Review event details and refer to the TOP Server "server specific" help file for direction.
- Navigate to the Server help file by going to "Help" > "Server Help..." in the TOP Server configuration.
As you might have experienced, the reason behind some messages are more obvious than others. It can be difficult to know where to start with errors like "device is not responding", but they may be preceded by other notable messages, some of which may only appear upon the initial device connection or other specific circumstances. This is why it is important to review the Event Log in its full context. That's why we ask you to make sure you send us event logs that match the time the issue occurred. Our team will look at events before the problem started and after to gain insights.
For projects with many tags/devices or rapid communications, relevant messages to the issue can go unnoticed with Event Log traffic moving so fast. You can turn off automatic scrolling of the Event Log by right-clicking and unchecking "Autoscroll", and you can also save the events to a text file by right-clicking and selecting "Save As Text File..." for further analysis.
Now, let's get to troubleshooting
While the Event Log can provide some insight into your issues, you may need more in-depth testing to resolve your problem. Next we will set up tests to control certain variables and observe the effects of induced changes. Specifically, we will look at how to troubleshoot when a client is not receiving any data from TOP Server.
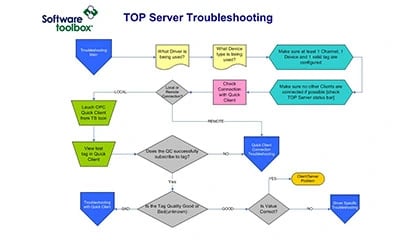
Although this post is focused on a device side issue, when developing a good troubleshooting procedure it is important to isolate the source of a problem through the process of elimination. If you see no data flowing to your client, you need to determine if the problem lies between TOP Server and the device or between TOP Server and your client configuration. The diagram below helps illustrate this concept and the tools this post will focus on. There are other tools for more challenging situations, so this diagram is not all inclusive.
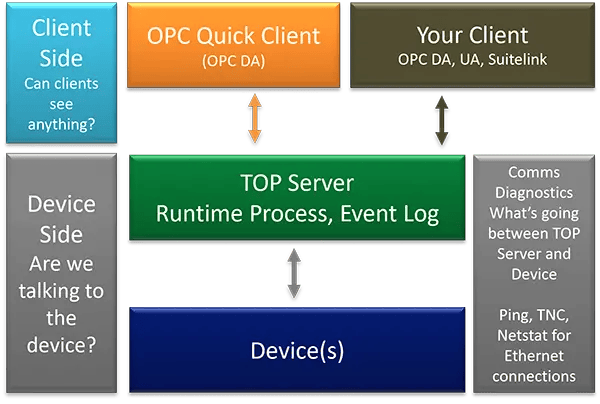 Note: For our use case, we will be troubleshooting in a scenario using a local OPC DA client connection to the TOP Server. Remote clients could encounter other issues relative to network connections and communication paths. Troubleshooting remote clients would require other tools not covered in this blog, which include OPC Diagnostics, Wireshark, etc.
Troubleshooting the Client Side
With the installation of TOP Server comes a lightweight OPC DA test client which can be used to rule out external clients as part of the issue. It is good practice to isolate communication elements as much as you can to observe only relevant factors. Completely disconnecting the external clients from TOP Server is recommended when isolating communication between just TOP Server and the Quick Client. If this is not possible, disabling them from requesting data on the problem device is the next best option. Please refer to your client documentation to accomplish this. If not possible, the troubleshooting tips here will still be valuable.
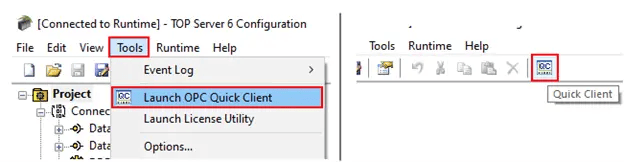
To launch the Quick Client from the TOP Server configuration, you can go to Tools > Launch OPC Quick Client or you can click the Quick Client symbol in the icon menu.
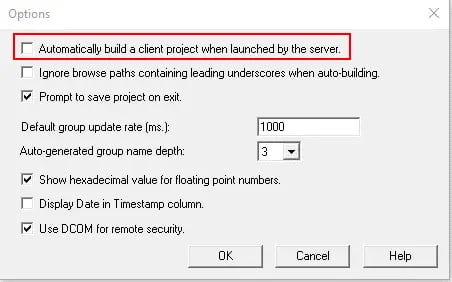
Launching the Quick Client from the TOP Server configuration window will, by default, automatically add all tags that TOP Server is exposing on its OPC DA interface. This can be disabled in the Tools > Options menu in the Quick Client.
For further details on navigating the Quick Client interface, check out our blog post on 5 Tips for Using OPC Quick Client.
To reduce the number of problem variables as much as possible, we will monitor communications to a single tag that...
- References a defined point in the device’s address space.
- Has a known data type.
- Has a known expected value or range of values.
- Has read/write permissions.
For some protocols, the data type of a tag is dictated by its address syntax or location, but it’s good practice to confirm what we expect for the tag we are observing. It’s not required that the chosen tag has read/write permissions (unless the issue you are experiencing is specific to write requests), but it does give us more control in our tests. For example, if the issue only appears with a specific client, we can compare behaviors and determine if data changes are captured.
As covered in our previous post, the Quick Client application returns OPC DA quality codes as well as values for tags or items requested.
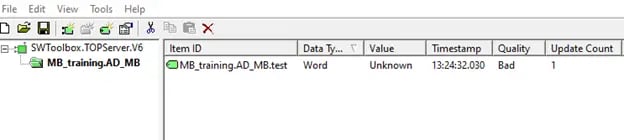
The provided OPC DA quality codes can also be helpful in determining where the communication issue lies. If you see values with good quality, you can rule out a problem with the connection between TOP Server and the device as well as the device specific settings in TOP Server. Instead, you can focus on the connection between TOP Server and your external client. If the opposite is true, as in our case, you can direct your troubleshooting efforts downstream.
Troubleshooting the Device Side
Now that we've ruled out a client issue, we can focus on communication between TOP Server and the device. As previously mentioned, the TOP Server Modbus Ethernet driver will be the focus for this post, but the troubleshooting process we use will be applicable for other drivers as well.
First in your Event Log are you having Device Not Responding errors as shown earlier? If so, recall that means that the driver sent a request to the device, and no response received in the timeout period times the number of retries, which in most drivers is 3 retries with a 3000 ms timeout, or 9 seconds total.
Before we go into deeper tools, ask yourself some questions. We know you're a skilled engineer or technician, but we are all humans and probably have all missed the "simple stuff" before. You're going to see these again in the discussion of communications diagnostics and the evidence that these problems exist that will appear.
- Did you ever have successful communications to this device or is this a new configuration?
- If you had successful communications before using the current configuration, then "what changed".
- If your configuration hasn't changed, software does not recompile itself in the field! Something had to have changed if you are no longer having successful communications
- If this is a new configuration then you may likely have a configuration issue.
- Are you sure the device is turned on? That may seem obvious but we have helped users where remote field devices are off and the controls technician troubleshooting is has not been told the device it out of service or they were told it is in service, when in reality it isn't!
- Are there any other applications talking to the device successfully? If so then the device must be on of course, and the problem may be in the driver configuration.
- Common errors include invalid serial node ID, invalid device IP address, and invalid serial communications settings. We could be sending a request but to the wrong device or at the wrong speed.
- Does the device support or has it ever supported more than one simultaneous connection?
- We have seen devices that allow limited concurrent Ethernet connections
- Make sure you have re-checked these items before moving deeper.
- Are you sure the device using Modbus TCP? Another question that may sound silly, yes there is a different way!
- If you have a serial/ethernet convertor or gateway on the device, some of the devices will wrap the Modbus Serial packet in a TCP/IP wrapper but do NOT insert the Modbus TCP Header. That's Ethernet Encapsulated Modbus and requires different settings in the TOP Server drivers
- The Modbus Ethernet driver by default expects you to be using Modbus TCP which inserts a 9 byte header into the frame. If you're using Modbus Ethernet Encapsulated you need to use the Modbus RTU Serial Driver with Ethernet Encapsulation Enabled. The good news that driver is included with the Modbus Suite so you already own it with your license if you have one.
- Also there are variants of Modbus TCP like Lufkin ELAM which uses a larger packet size for Oil & Gas RTU's which has it's own driver. When in doubt, ask us!
- If you have a serial/ethernet convertor or gateway on the device, some of the devices will wrap the Modbus Serial packet in a TCP/IP wrapper but do NOT insert the Modbus TCP Header. That's Ethernet Encapsulated Modbus and requires different settings in the TOP Server drivers
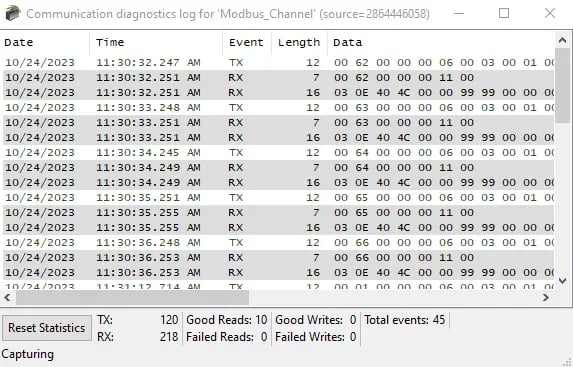
Assuming you've thought of all the items above, then a good next step is to determine if TOP Server is receiving any response from the device using the Communications Diagnostics tool. This feature provides a streaming protocol view and real-time performance data for your communications driver. All read and write operations between the server and the device can be viewed in the diagnostic display window in the form of transmits (TX) and receives (RX).
The TOP Server Communication Diagnostics can be found by right clicking on the configured device or channel as shown below.
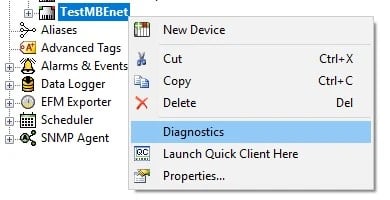 If you do not see the option then you must enable diagnostics capture in the channel properties by right-clicking on your channel and going to Properties > General and selecting Enable for "Diagnostics Capture". Once enabled, the option above will be visible and selectable.
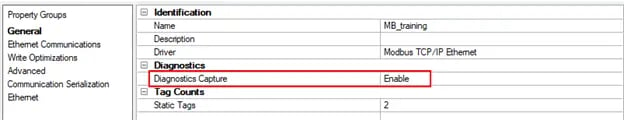
As you can see below, each send and receive is timestamped. This helps with analyzing round trip communication time with a device to diagnose responsiveness. You can easily see how long it took a device to respond to the last request, allowing you to confirm if an issue exists with the device or something else. That device response time is very helpful when there are performance issues. You might be surprised at how fast or slow some devices respond. Remember control devices are there to control. Communications is secondary. A heavily loaded PLC might not be responding as fast as you think it is. Or network issues may show up as highly variable response times.
The bottom of the diagnostic window also shows the number of sends and receives and if they are successful or not. These values can also be monitored in system tags in your client application and even be reset via a special system tag. Click here for more information on how to harness the power of System and Statistics tags.
There are 3 common scenarios you might encounter in the Communication Diagnostics:
- No TX or RX: this tends to mean that—
- There are no connected clients requesting communications through this channel or device, in which case you need to use the OPC Quick Client to subscribe to a tag or address, or
- For TCP connections, TOP Server cannot establish a socket connection with the device. We cover what to do here later in this post
- TX, but no RX: this means that TOP Server can send requests to the destination device but is not getting a response within the Timing properties configured in the device. You will typically see the same TX message sent 3 times (or to whatever value the Attempts Before Timeout is configured at) before it moved on to the next request. If you experience this, consider:
- The device is not being given enough time to formulate a response, which can be addressed in the Timing settings on the Device Properties.
- A firewall could be keeping our request from reaching the device or the device’s response from reaching TOP Server. Just because traffic goes out a port on a firewall does not mean the rules will allow traffic back in on that port. Misconfigurations do happen.
- For Serial or UDP connections, the device connectivity parameters, such as COM port, baud rate, IP address, port, etc., could be incorrect, as neither establishes a socket connection nor uses handshaking for validation in the case of UDP.
- The request is improperly formatted in such a way that the device cannot formulate a reply. For example: Modbus TCP vs. Ethernet-Encapsulated Modbus RTU, or Modbus RTU vs Modbus ASCII, as mentioned earlier.
- The ID specified in the device properties is incorrect— protocols like Modbus allow for network configurations where requests are effectively broadcast to all connected devices, and only the one with the specified ID responds. This means that a device may be ignoring requests because it uses a different identifier.
- The device is in an error state and is unable to respond to any communication attempts.
- TX, but inconsistent RX:
- You could be asking more of the device and network than it can handle. This could be too much too fast for the device turnaround time, or too many other applications trying to communicate at the same time, and the device gets overwhelmed to the point it can't send back the data for some requests. Increasing the timeout or decreasing the scan rate may also resolve this.
- The more common reason for this is that there are problems on the network that are intermittent but there are other possibilities.
- Sometimes Modbus Ethernet devices do not support the full protocol allowed block size, or they have problems when blocked reads reach into spaces they do not use. In those cases you can reconfigure block sizes in the Device Properties but it helps first to consult the device communications guide to see what it's limits are.
In our example case, we are experiencing scenario number one, No Tx or Rx. This tells us we need to troubleshoot our TCP connection to the device itself. Note the communications diagnostics window screenshot above is NOT representative of this use case but was provided to show you what that tool looks like.
Troubleshooting TCP Connections between TOP Server and the Device
Because we do not see any evidence of communication with the device in our Channel Diagnostics, our next step should be to determine if our device is even reachable. Is it even plugged in? There are many tools available for troubleshooting Ethernet connections. Today we will cover Ping, TNC Command, and Netstat.
Ping
When troubleshooting TCP connections, often users use the Ping command to determine if a remote host is reachable. This command is meant to tell a user if a particular destination IP address exists and if it can accept ICMP requests. The shortcomings of the Ping command can be summarized in that the command simply does not give us enough information to make an intelligent conclusion of why a controller or network node is not communicating.
If a Ping is successful, we now know that there is a “black box” at the given IP destination. What we need to now know is if there a TCP port actively listening for our connection attempts. This brings us to the Test Network Connection (TNC) command in PowerShell.
Test Network Connection (TNC)
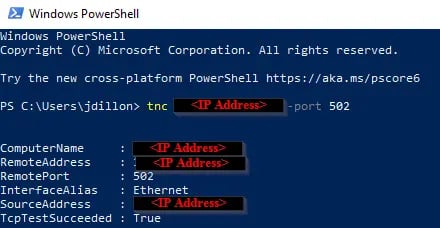
The TNC command helps you determine whether a TCP connection can be established with the device over a specified port. You will receive the response TcpTestSucceeded: True or False. This response indicates whether the TCP Connection can be made to the device/remote host on the given port.
Netstat
Lastly, the netstat command can also be used to show the current network status of the device. The output of this command will show:
- Whether we are even looking at an open connection.
- What the state of the connection is:
- Established: Connection is good.
- SYN_SENT: request was sent by no response has been received.
- TIME/CLOSE_WAIT: The connection was opened and closed, or close immediately.

For our use case, we first ran the Ping command and found there was no response. This told us our device was not reachable. To confirm, we decided to take the extra time and run the TNC command from Windows PowerShell. The result was TcpTestSucceeded: False. This again verified our device was not reachable.
After examining the device, we saw the ethernet cable was dislodged from its plug. After fixing the connection we received successful results from all the above commands and data started to flow to all clients connected to TOP Server. Success!
Conclusion
 In this post, we walked through an example of how to approach troubleshooting effectively and systematically using troubleshooting tools related to device connectivity issues. In a future post, we will investigate a different scenario to cover troubleshooting tools that can assist in detecting client connectivity issues as well as dig into the adjustable device connectivity properties.
We highly recommend that you also consult the Interactive TOP Server Troubleshooting Flowchart available in our knowledgebase as a tool to help logically walk through what we just covered.
We hope this information has been helpful in getting you started tackling communication issues. Check out our TOP Server Learning Resources for more information and tutorial videos to help you get started collecting real-time data from your devices using TOP Server.
As always, please contact our support team with any questions and don't forget to subscribe to our blog to find out about the latest updates to TOP Server.
Ready to try TOP Server with your devices? Download the fully-functional free trial.