In this edition of OPC Talk with Win and Marc, we’re going to discuss when things go wrong and how do you know? No matter what OPC software you’re using, there are many things that can happen that could cause system problems. Most people would rather know about a problem before it ruins their day, week, month, or career, right?
How do I know if the OPC server is communicating to all my devices”?
Marc: Many OPC servers have built-in tags that are automatically available for each communications path and device that can tell you if communications are active or not. Because the information is available as an OPC item or tag, you can display it in your HMI/SCADA system, track it in your historian and even integrate it into your call-out or alarming systems. In TOP Server for Wonderware, every device has two tags that help with this: “_Error” and “_NoError” that are just logical complements of each other, to suit any user needs. When _Error is a 1, _NoError is a 0. When _Error is a 0, _NoError is a 1.
In a similar fashion our OmniServer OPC Server has a status bit for each device that indicates when the device is no longer responding to our requests. The “Status” tag for each device is high (1) as long as the device communications are healthy, and goes low (0) when the device fails to respond.
In the Cogent DataHub, which many of our users use to eliminate DCOM and securely tunnel information between remote assets and sites, there are tags that show the status of the tunnel health. The DataHub is not limited to just telling you the health of a tunnel connection. Any connection in the DataHub Connection Viewer can show the status of that connection. This includes OPC DA, OPC UA, OPC A&E, DDE, WebView connections and more.

Is there a way to know how many communications errors I am getting on specific devices?
Win: Usually there are other built-in tags in OPC servers that tell you how many errors you have had, how many successful read/writes, and more. For example in TOP Server, each device has tags such as SuccessfulReads, SuccessfulWrites, FailedReads, FailedWrites and others as shown here.

In OmniServer there are built in tags like polls attempted and polls completed that show us how many of our requests have gone unanswered. These tags can easily be used to calculate the performance and/or indicate the health of a connection. Like the tags Marc spoke about, these can be displayed in your HMI/SCADA screens, logged, and alarmed on just like any process tag in an OPC server.
How can I know what the specific communications error messages are on these control devices?
Marc: Most OPC Servers have an event log that stores more detailed communications error messages. In the TOP Server for example, these are stored in the Event log that can be persisted to disk and stored for any number of days depending on how you configure it. Similary, OmniServer maintains an event that shows any error messages the server is encountering, and simultaneously supports writing these events to disk.

If you want to be proactively notified on certain errors by email or SMS/text there, are a few options. The TOP Server has a built-in ability to make all event log entries available as they are generated using the OPC A&E standard as an OPC A&E Server. You just enable this in the TOP Server A&E plugin. This plugin allows you to associate limits and alarm conditions to specific server tags. If you have an alarming or call-out system already that is an OPC A&E client, then you can connect it to the TOP Server and generate alerts.
If you don’t already have an alarming or call-out system, the Cogent DataHub is an OPC A&E Client and its Email/SMS capability, combined with the free, built-in scripting engine, enable you to perform very specific actions to suit your needs, and log the data to a SQL database.
We have also seen people use the Cogent DataHub’s OPC Gateway capabilities to transform the OPC A&E data to OPC DA or OPC UA tags, which they then consume in other applications that can only consume OPC DA or UA.
Lastly using the Software Toolbox .NET OPC Server Configuration API, we have written utilities that can centralize TOP Server or KEPServer-EX event log data from multiple OPC servers into a single SQL database for reporting and alerting. Contact us if you’re interested in learning more about this.
How might I tell if the OPC server is asking too much of a device or the network connection to the device?
Marc: As we mentioned earlier, the OmniServer tracks the number of polls attempted as well as the number of polls completed. If we see a large number of polls going unanswered this could be the first sign that a device is overloaded or that there is an issue with your network.

Win: A common thing people forget about is that communications is a system with many parts. People forget that the driver may not be the limiting factor, but rather the PLC response time, complexity of the PLC protocol, network type (serial vs Ethernet) and even the network can come the limiting factor. When people contact me to discuss performance concerns in a system, my favorite built-in system tags in TOP Server for Wonderware, the Max Pending Reads and Max Pending Writes tags that help you to know if you are just asking too much of your PLC or network.
I am using redundant controllers and want to know which controller the OPC server is talking to?
Marc: Just like the built-in tags we discussed earlier, when using the redundancy capabilities in TOP Server for Wonderware, there are tags that tell you which controller communications are flowing through. The _System._ActivePath tag will always show through which redundant connection the TOP Server is currently communicating as shown below.

I need to receive an email or SMS/text when redundant failover or failback happens – how can I do that?
Win: In our blog about redundancy, we discussed different ways to manage redundancy at various levels. At the bottom of that blog post we show the tags DataHub creates to give you visibility into which OPC sources are available and active. These tags include; IsPrimaryActive, IsSecondaryActive, CurrentSource and PreferredSource.

Using the DataHub Email/SMS capabilities in conjunction with these tags you can send an email or text message that would notify people that a failover occurred.
How can I monitor the OPC server process itself and get notified if it goes down or auto-restarts?
Marc: We have had users use the Cogent DataHub system monitor and Email/SMS capability to do exactly this as well as monitor the overall health of the server or PC operating system and hardware at the same time. If this is something that interests you, Win published a post about monitoring operations technology system health that is worth a read to see all the things that are possible.
I have redundant OPC Servers that my OPC client talks to. How can I know which OPC server is currently being accessed by the OPC client?
Win: To build upon a previous answer, when using redundancy in the DataHub we have access to tags that tell which OPC server are available and which one the DataHub is currently connected to in a configuration like the one shown here.

In the image below the tags show us that DataHub is connected to both the primary and the secondary (IsPrimaryActive and IsSecondaryActive are a 1), but the current source is the Primary OPC Server since CurrentSource has a value of 1.
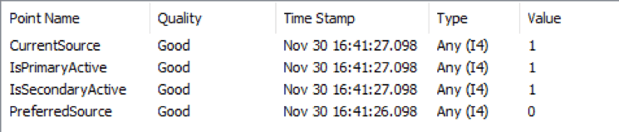
By monitoring the CurrentSource tag in DataHub we can easily know which OPC Server connection is active. In the above example if CurrentSource had a value of “2” the secondary would be the one being used. If CurrentSource had a value of “0” then most likely the primary and secondary are both not active, and therefore there is no communication happening.
I need to be notified if there are communications problems but only during certain critical process operations which I can detect based on the state of certain PLC tags.
Marc: This is an area where users I have helped have found the built in scripting engine in Cogent DataHub to be very powerful. They used the ability of the Cogent DataHub to read any OPC DA or OPC UA data source, and then based on conditions, send out email or SMS notifications with the same DataHub. If you have a database that stores a schedule that tells you when critical operations should be occurring, or even a schedule of who to alert at different times, Cogent DataHub can read that schedule and use it.
Another option is to use the TOP Server A&E Plug-In to alarm off existing tags in your server. This plug-in allows you to define high and low alarm limits for tags – the alarms for which will fire when one of these limits is exceeded. Once these are defined you can read this alarm information using the Cogent DataHub and trigger email or SMS notifications to be sent if one of these alarm conditions becomes active.
I am logging data I retrieve from OPC servers to a database but need to know if the database goes down and logging isn’t happening.
Win: I’ve had users who use the Cogent DataHub OPC Logger feature for their logging accomplish this using the built in scripting engine and the email/SMS alerting function in the DataHub.
Similarly, with OPC Data Logger and the ability to write back when the DB connection is lost or comes online. The OPC Data Logger has the ability to write back to an OPC item when it connects to the database, if the connection to the database is lost or each time it sends data to the database.

I know that communications cannot be perfect all the time, but I do want to know when a device is offline for a certain amount of time.
Marc: This is possible using the Cogent DataHub connected to your OPC Server. The DataHub would look for a tag quality of Bad or Not Connected. Once it sees this quality change it can monitor the quality and after a specified time period set a tag in the DataHub that shows the connection has been active for a time period. Alternatively this information could be emailed using the DataHub Email/SMS feature.
I want to receive an alarm when certain KPIs (measured values, etc) fall out of a specified range – since this indicates a problem with the process
Win: This is an area where we’ve helped users of about any OPC DA or UA server on the market do this. The Cogent DataHub can connect to any OPC DA or UA server as an OPC client, making that data available to the DataHub’s Email/SMS engine. When configuring the DataHub Email/SMS functionality, you get to specify limits based on process tags accessed from those OPC servers, or for that matter any other data source, and then send alerts when 1 or more conditions are met. I’ve had a few users wanting to do very unique conditional logic and in those cases the free, built-in scripting engine in the DataHub was a key part of their solution.
I want to monitor that a heartbeat tag is updating regularly to make sure that communications are alive.
Marc: This may sound far-fetched but I’ve seen this done before with Cogent DataHub. Readers may not realize it but many OPC servers expose a built-in tag that displays a constantly changing value like the number of seconds on the clock. By connecting to the OPC server with OPC UA or DA, we monitor those tags with the Cogent DataHub and on a set time interval check to see how much the monitored tag has changed if at all. If the data hasn’t changed or has “jumps” that indicate data is not coming as fast as you might want, we send alerts using the email/SMS functionality in DataHub. If readers are interested in implementing this type of solution in a project, they can send me a question through the Ask a DataHub question page.
Conclusions:
No matter what brand OPC DA or UA server you are using, there are a lot of ways to have your OPC applications tell you when there are problems, using a variety of notification methods. Each OPC DA or OPC UA server may have different built in diagnostic information, but if there is any available, it can be accessed and used for notifications.
There’s no cost or obligation to discuss your challenges with our applications engineers and put their experience to work for you.
About the Authors:
Win Worrall: Win studied software engineering and has been working at Software Toolbox since 2007. Win started out in product support and has worked with hundreds of users around the world with about every product in Software Toolbox's mix. Win currently is responsible for product management of the Cogent DataHub offering within Software Toolbox's range of products. Got questions about DataHub scripting, click above to "ask Win!"
Marc Holbach: Marc works in a variety of roles on our team. He started out in product support and is currently the technical applications consultant lead. Marc loves to dig into technologies, challenges, learning new things and helping our clients apply our products in clever ways. Marc also manages our extensive test lab where we have a zoo of automation hardware that we use to test our products against and to aid in client support.

Marc and I hope this post has helped you better understand what’s possible. An important part about knowing Software Toolbox is that we make ourselves available to talk about these types of challenges and your specific problems. If you’d like to arrange to talk with one of us, just click on the image below to request an appointment.
If you’d like to try some of the products that we mentioned in this post, here are links to the product download pages:

